> ## Documentation Index
> Fetch the complete documentation index at: https://docs.openlayer.com/llms.txt
> Use this file to discover all available pages before exploring further.
# Anomaly detection
> How Openlayer detects and explains unexpected changes in your tables
Openlayer’s anomaly detection helps you spot **unexpected changes in production data** with
minimal setup. It powers the [Anomaly detection test](/tests/catalog/anomalous-column-count) and flags
when metrics for a column deviate from their learned “normal” behavior.
## What it monitors
For each table you connect, Openlayer maintains time series for:
* **Numeric columns** — the **mean** daily value over time.
* **Categorical columns** — the **counts** of the daily **top categories** over time.
These series are learned per column and continuously updated as new data arrives.
## How detection works
Behind the scenes, what Openlayer is doing is:
We fit time-series models per monitored metric (numeric mean, categorical
counts). The model captures trend/seasonality and estimates an **expected
range** (upper & lower bounds) for each evaluation window.
For the current window, the model predicts the upper and lower bounds.
We compare the **observed value** with the predicted range. If the observed
value is outside the predicted range, it is flagged as an anomaly.
Models are **retrained regularly** so the expected range improves as your
data evolves.
## Visualizing results
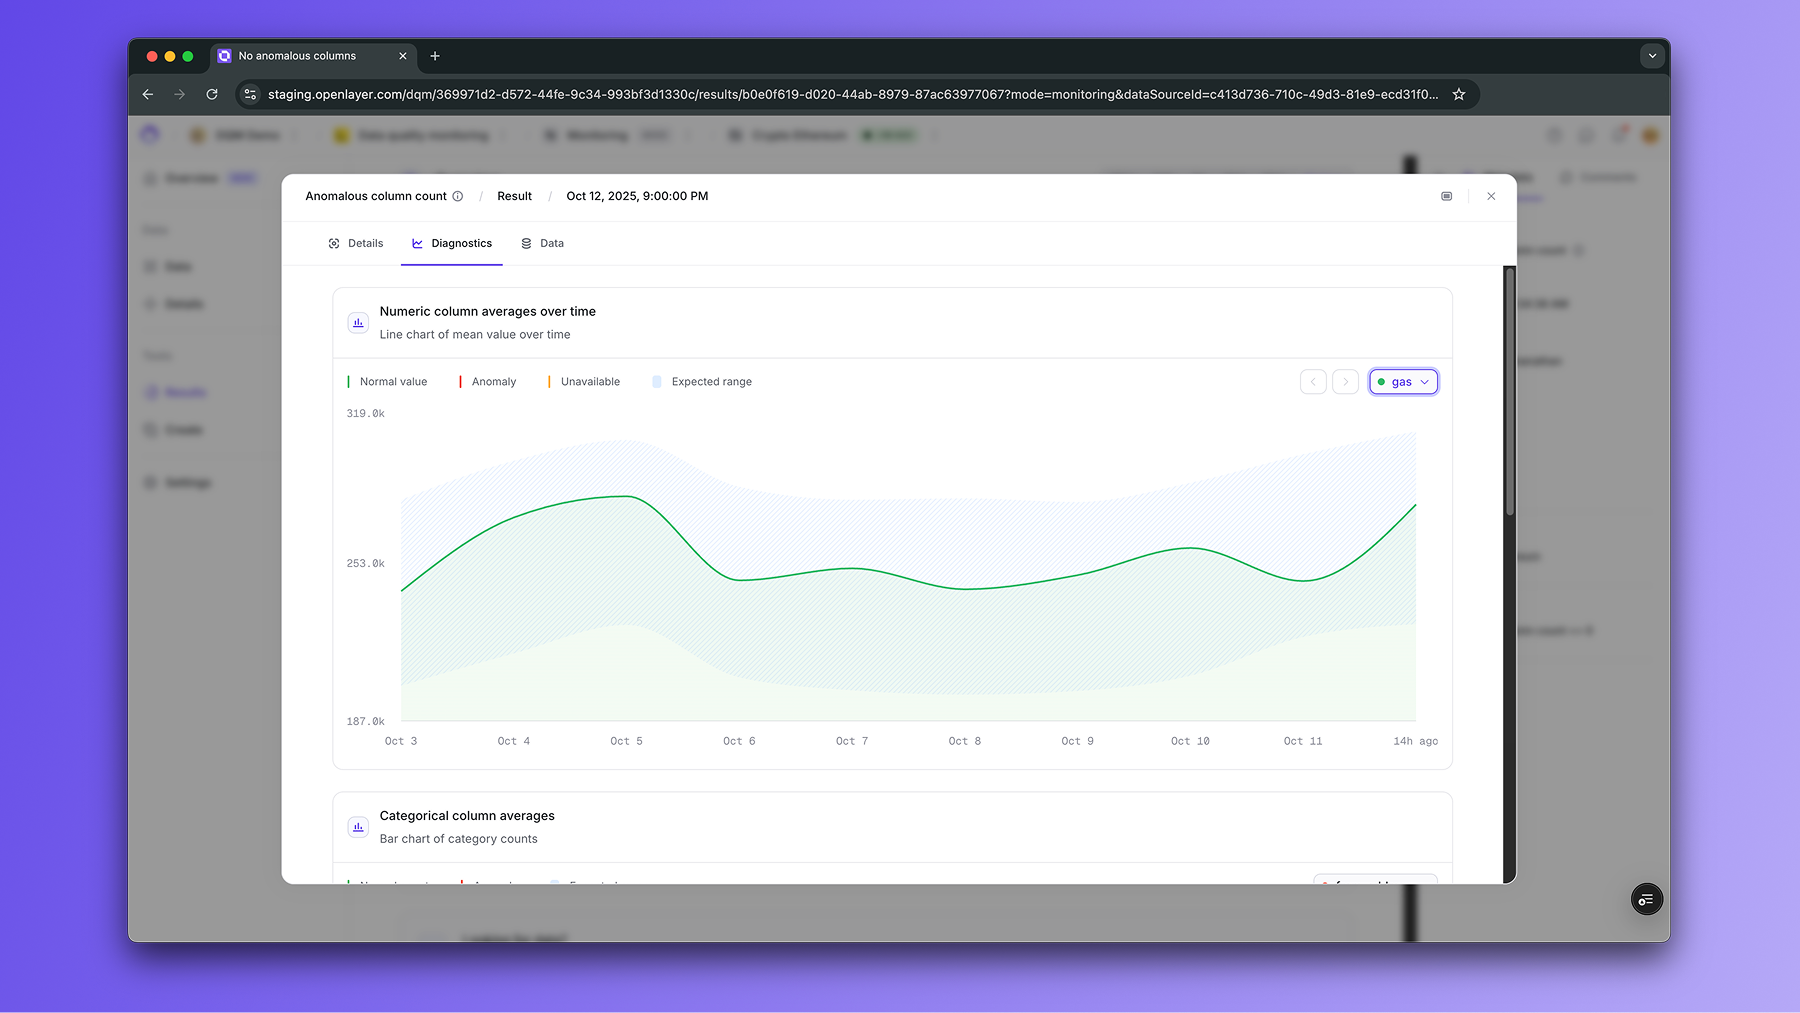
When an anomaly is detected, the result view shows:
* A **time-series chart** with the observed value and the **expected range band**.
Green points fall within the band; orange points indicate anomalies.
* A **per-column selector** to inspect any monitored metric individually.
 ## Root-cause analysis (RCA)
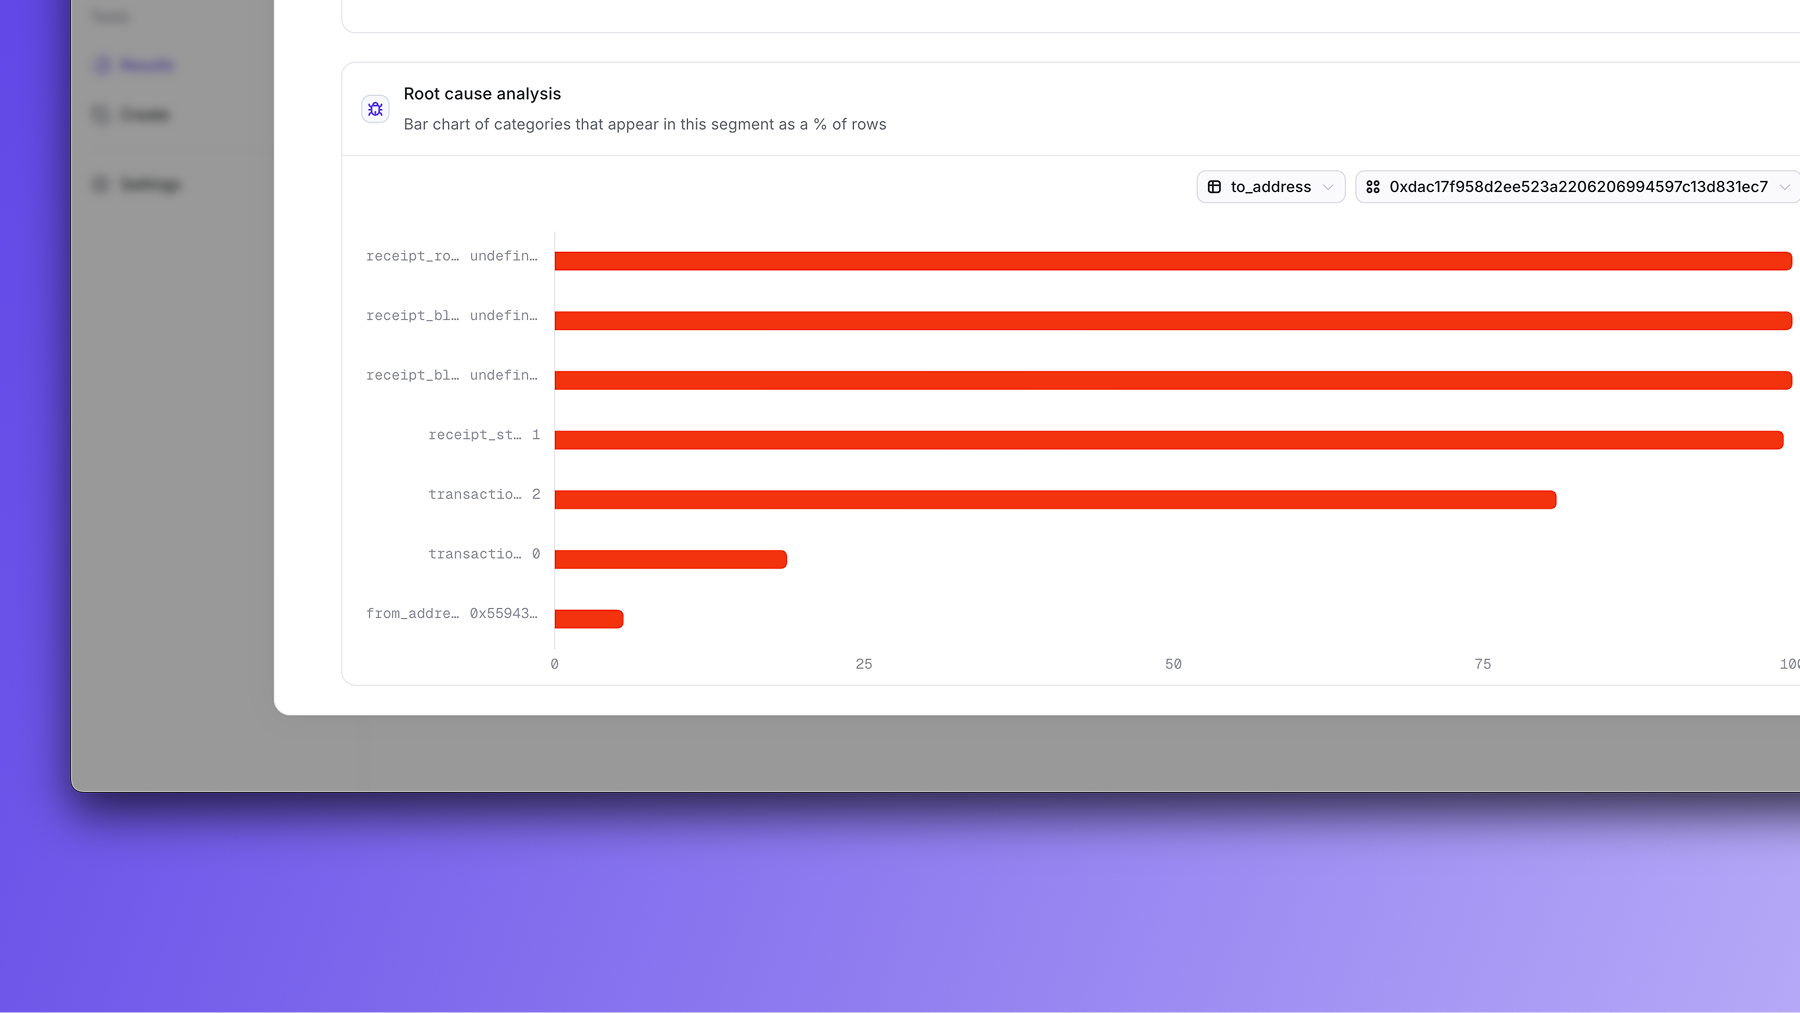
For **categorical** anomalies, the Diagnostics tab includes **RCA**:
* Pick one or more categorical columns.
* See which **values were predominant** when the anomaly occurred.
* Use this to quickly form hypotheses (e.g., “spike only for `to_address = X`”),
trace pipeline issues, or decide whether to suppress a benign seasonal effect.
## Root-cause analysis (RCA)
For **categorical** anomalies, the Diagnostics tab includes **RCA**:
* Pick one or more categorical columns.
* See which **values were predominant** when the anomaly occurred.
* Use this to quickly form hypotheses (e.g., “spike only for `to_address = X`”),
trace pipeline issues, or decide whether to suppress a benign seasonal effect.
 ## Configuration tips
* **Confidence interval (`interval_width`)**
Smaller interval → **more sensitive** (more anomalies). Larger interval → less sensitive.
* **Timestamp column**
Required so Openlayer can order data by time and form windows.
* **Cold start**
New tables need some history to build a reliable baseline. Early bounds may be wider until the
model learns seasonality.
## FAQ
A per-window value (numeric mean or categorical count) that falls
**outside** the model’s predicted upper/lower bounds for that column.
Yes—both excursions above the upper bound and below the lower bound are
flagged.
Yes. As history grows, bounds adapt to recurring patterns, reducing false
positives.
Yes. Create an [Anomaly detection
test](/tests/catalog/anomalous-column-count) and configure notifications on
failures.
## Configuration tips
* **Confidence interval (`interval_width`)**
Smaller interval → **more sensitive** (more anomalies). Larger interval → less sensitive.
* **Timestamp column**
Required so Openlayer can order data by time and form windows.
* **Cold start**
New tables need some history to build a reliable baseline. Early bounds may be wider until the
model learns seasonality.
## FAQ
A per-window value (numeric mean or categorical count) that falls
**outside** the model’s predicted upper/lower bounds for that column.
Yes—both excursions above the upper bound and below the lower bound are
flagged.
Yes. As history grows, bounds adapt to recurring patterns, reducing false
positives.
Yes. Create an [Anomaly detection
test](/tests/catalog/anomalous-column-count) and configure notifications on
failures.