> ## Documentation Index
> Fetch the complete documentation index at: https://docs.openlayer.com/llms.txt
> Use this file to discover all available pages before exploring further.
# Overview
> Learn how to monitor the quality of your data tables with Openlayer
The quality of your data directly impacts the performance and trustworthiness of your AI systems and analytics.
But in production, datasets drift, pipelines break silently, and anomalies slip through unnoticed.
**Data quality monitoring** in Openlayer helps you continuously validate the **health of your tables** so you can detect issues before they cascade downstream.
## How it works
Integrating with Openlayer begins by connecting your warehouse or lakehouse (e.g.,
BigQuery, Databricks, Snowflake).
See the [Connect a data source](/data-quality-monitoring/connect-data-source) guide for details.
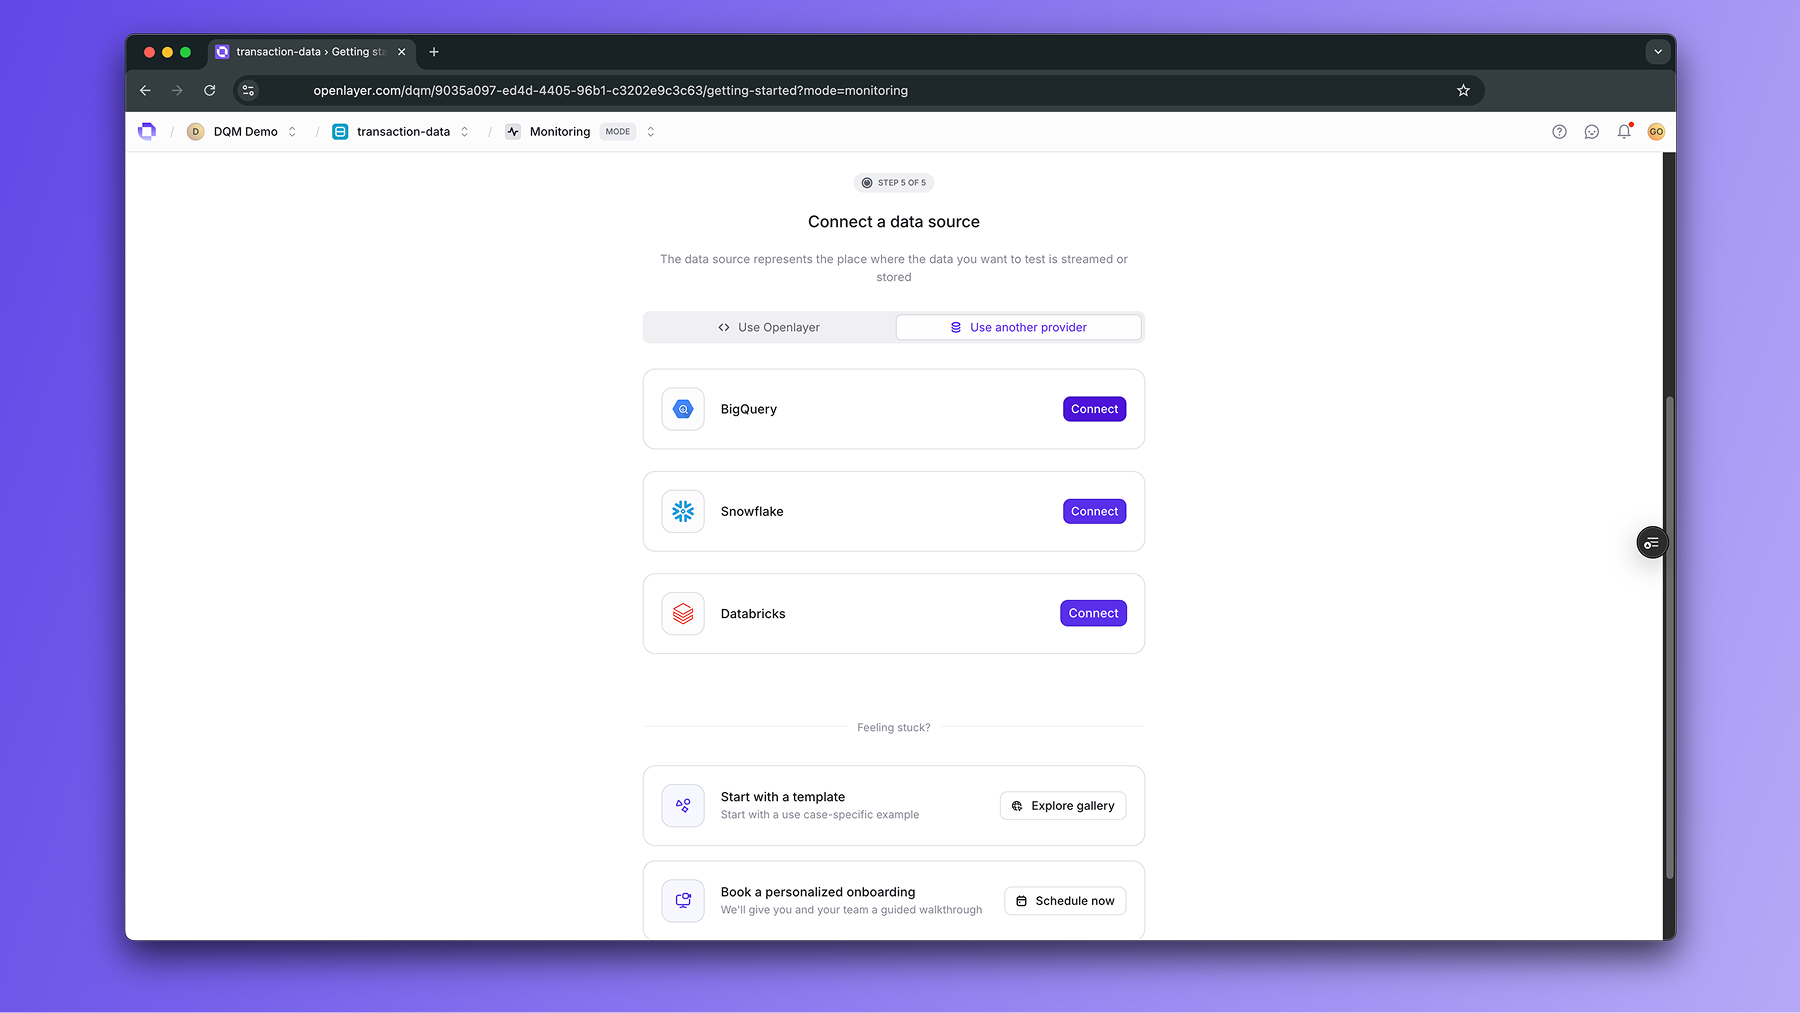 After providing the necessary credentials, you can choose which tables you want to track.
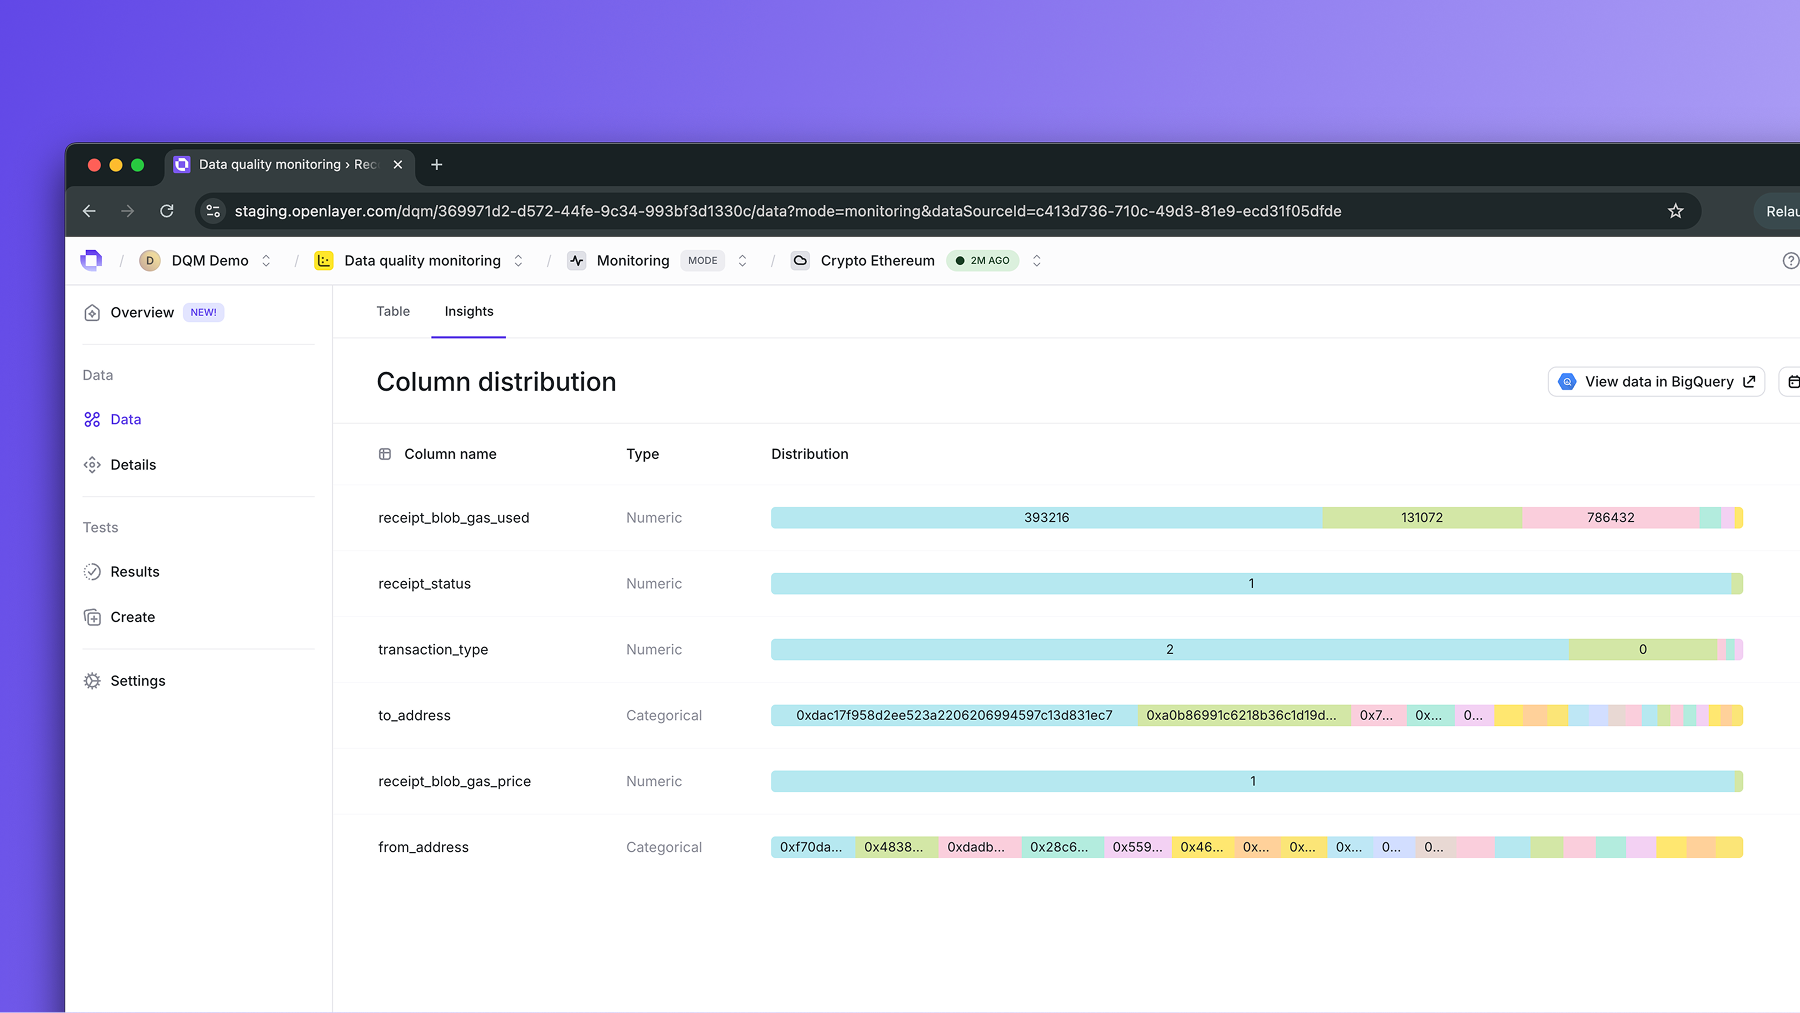
Openlayer automatically profiles them, capturing schema, distributions, and summary statistics.
After providing the necessary credentials, you can choose which tables you want to track.
Openlayer automatically profiles them, capturing schema, distributions, and summary statistics.
 Add tests on top of your tables.
Common examples include schema checks (unexpected columns, type mismatches)
and anomaly detection (sudden spikes or drops in key metrics, missing values, etc.)
Tests can run automatically at regular cadence on top of your tables.
Add tests on top of your tables.
Common examples include schema checks (unexpected columns, type mismatches)
and anomaly detection (sudden spikes or drops in key metrics, missing values, etc.)
Tests can run automatically at regular cadence on top of your tables.
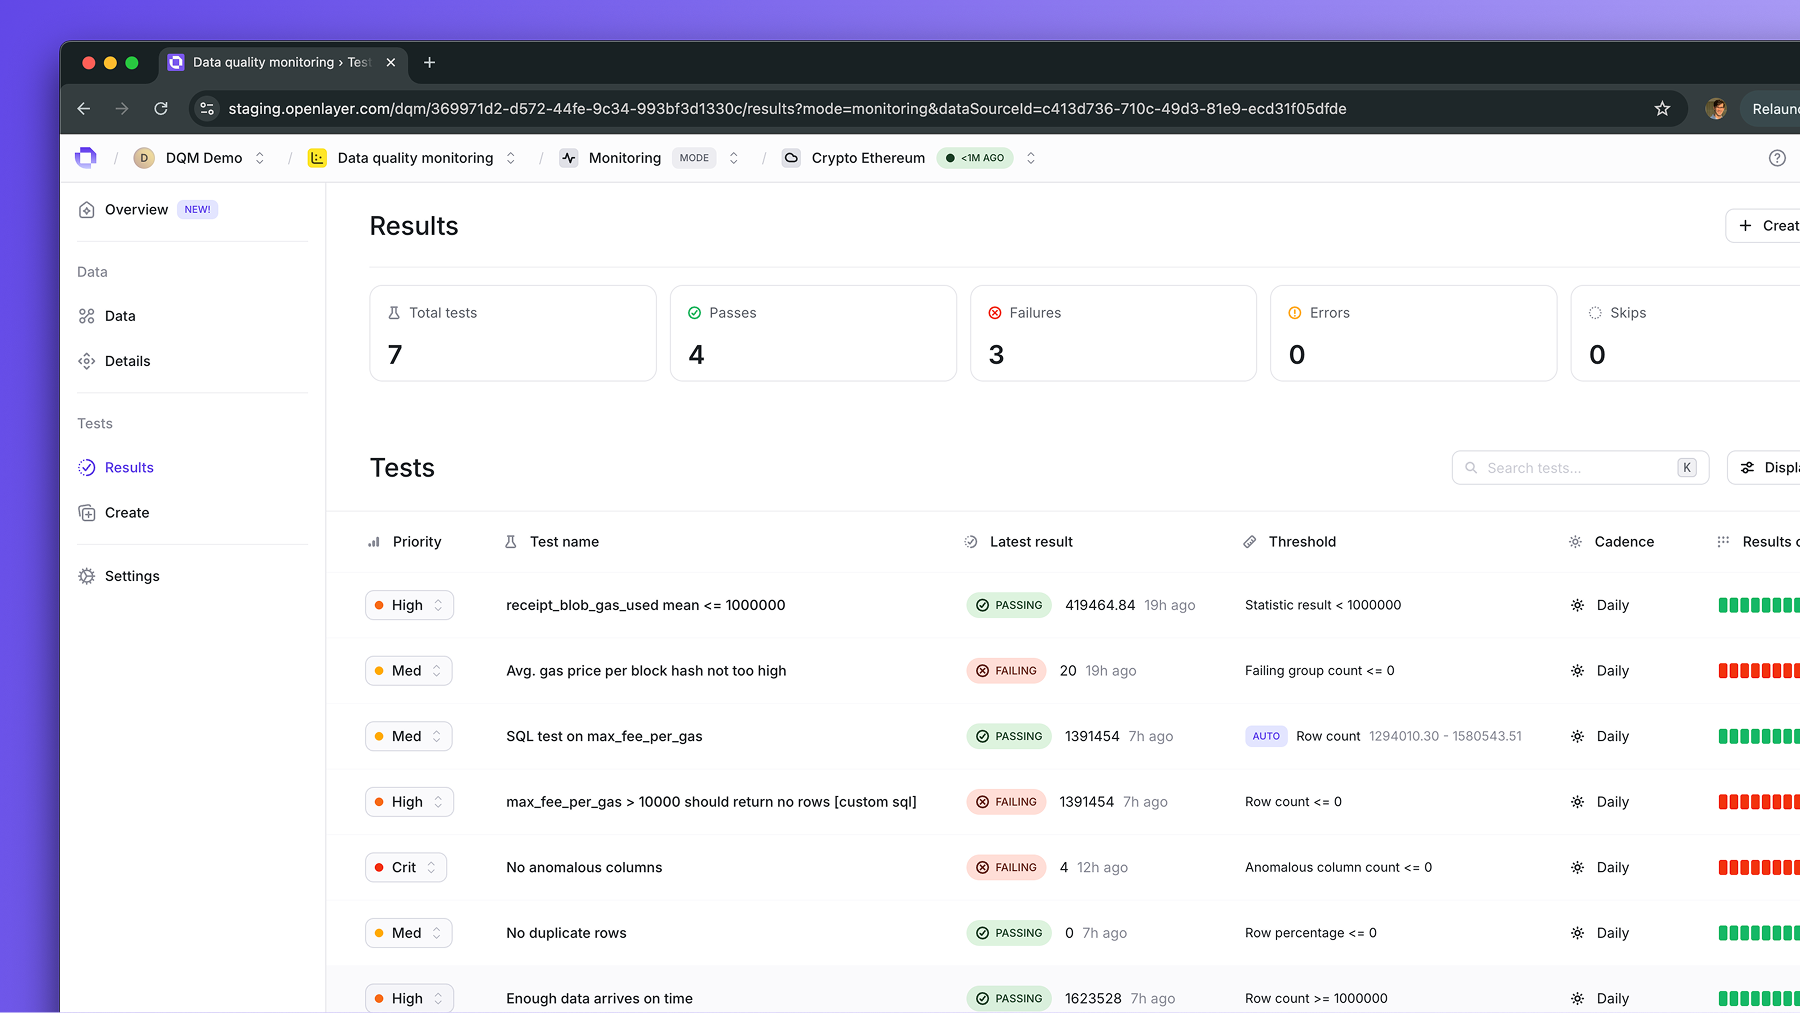 Openlayer tracks test results over time and alerts you immediately when an anomaly is detected.
This way, you can respond before bad data propagates into models, dashboards, or production systems.
## Next steps
By continuously monitoring table quality, Openlayer provides a feedback loop that keeps your data pipelines healthy and reliable.
To try it out, check out the [Connect a data source](/data-quality-monitoring/connect-data-source) guide.
## FAQ
No. Openlayer connects to your warehouse or lakehouse and runs tests directly on your tables.
Data does not need to be replicated unless you explicitly choose to export results.
Today, Openlayer supports BigQuery, Databricks, and Snowflake. We’re expanding
coverage to additional warehouses and data lakes. See the [Integrations
page](/integrations/overview) for the latest list.
* **Observability** focuses on tracing your AI system in production and testing its live requests.
* **Data quality monitoring** focuses on the **tables feeding those systems**, helping you detect issues at the data source before they affect downstream models or apps.
Many teams use both together: catch issues early in the data, and validate behavior in the AI system.
Openlayer tracks test results over time and alerts you immediately when an anomaly is detected.
This way, you can respond before bad data propagates into models, dashboards, or production systems.
## Next steps
By continuously monitoring table quality, Openlayer provides a feedback loop that keeps your data pipelines healthy and reliable.
To try it out, check out the [Connect a data source](/data-quality-monitoring/connect-data-source) guide.
## FAQ
No. Openlayer connects to your warehouse or lakehouse and runs tests directly on your tables.
Data does not need to be replicated unless you explicitly choose to export results.
Today, Openlayer supports BigQuery, Databricks, and Snowflake. We’re expanding
coverage to additional warehouses and data lakes. See the [Integrations
page](/integrations/overview) for the latest list.
* **Observability** focuses on tracing your AI system in production and testing its live requests.
* **Data quality monitoring** focuses on the **tables feeding those systems**, helping you detect issues at the data source before they affect downstream models or apps.
Many teams use both together: catch issues early in the data, and validate behavior in the AI system.