> ## Documentation Index
> Fetch the complete documentation index at: https://docs.openlayer.com/llms.txt
> Use this file to discover all available pages before exploring further.
# Overview
> Learn how to monitor your AI system with Openlayer
The performance of your AI system naturally fluctuates after you deploy it. Out in
the wild, it encounters new data, edge cases, and is susceptible to bugs like any other
piece of software.
**Monitoring mode** in Openlayer helps you continuously observe and evaluate your **live system**.
## How it works
Use [Openlayer's SDKs](/api-reference/sdk/overview) to instrument your code.
The SDKs trace the requests your system receives and send them to the
Openlayer platform.
It has streamlined integrations for popular frameworks such as OpenAI, Anthropic, LangChain, and many more.
But if you already use OpenTelemetry, or prefer to push events directly, you can send data using the REST API
See the [Instrument your code](/monitoring/instrument) guide for details.
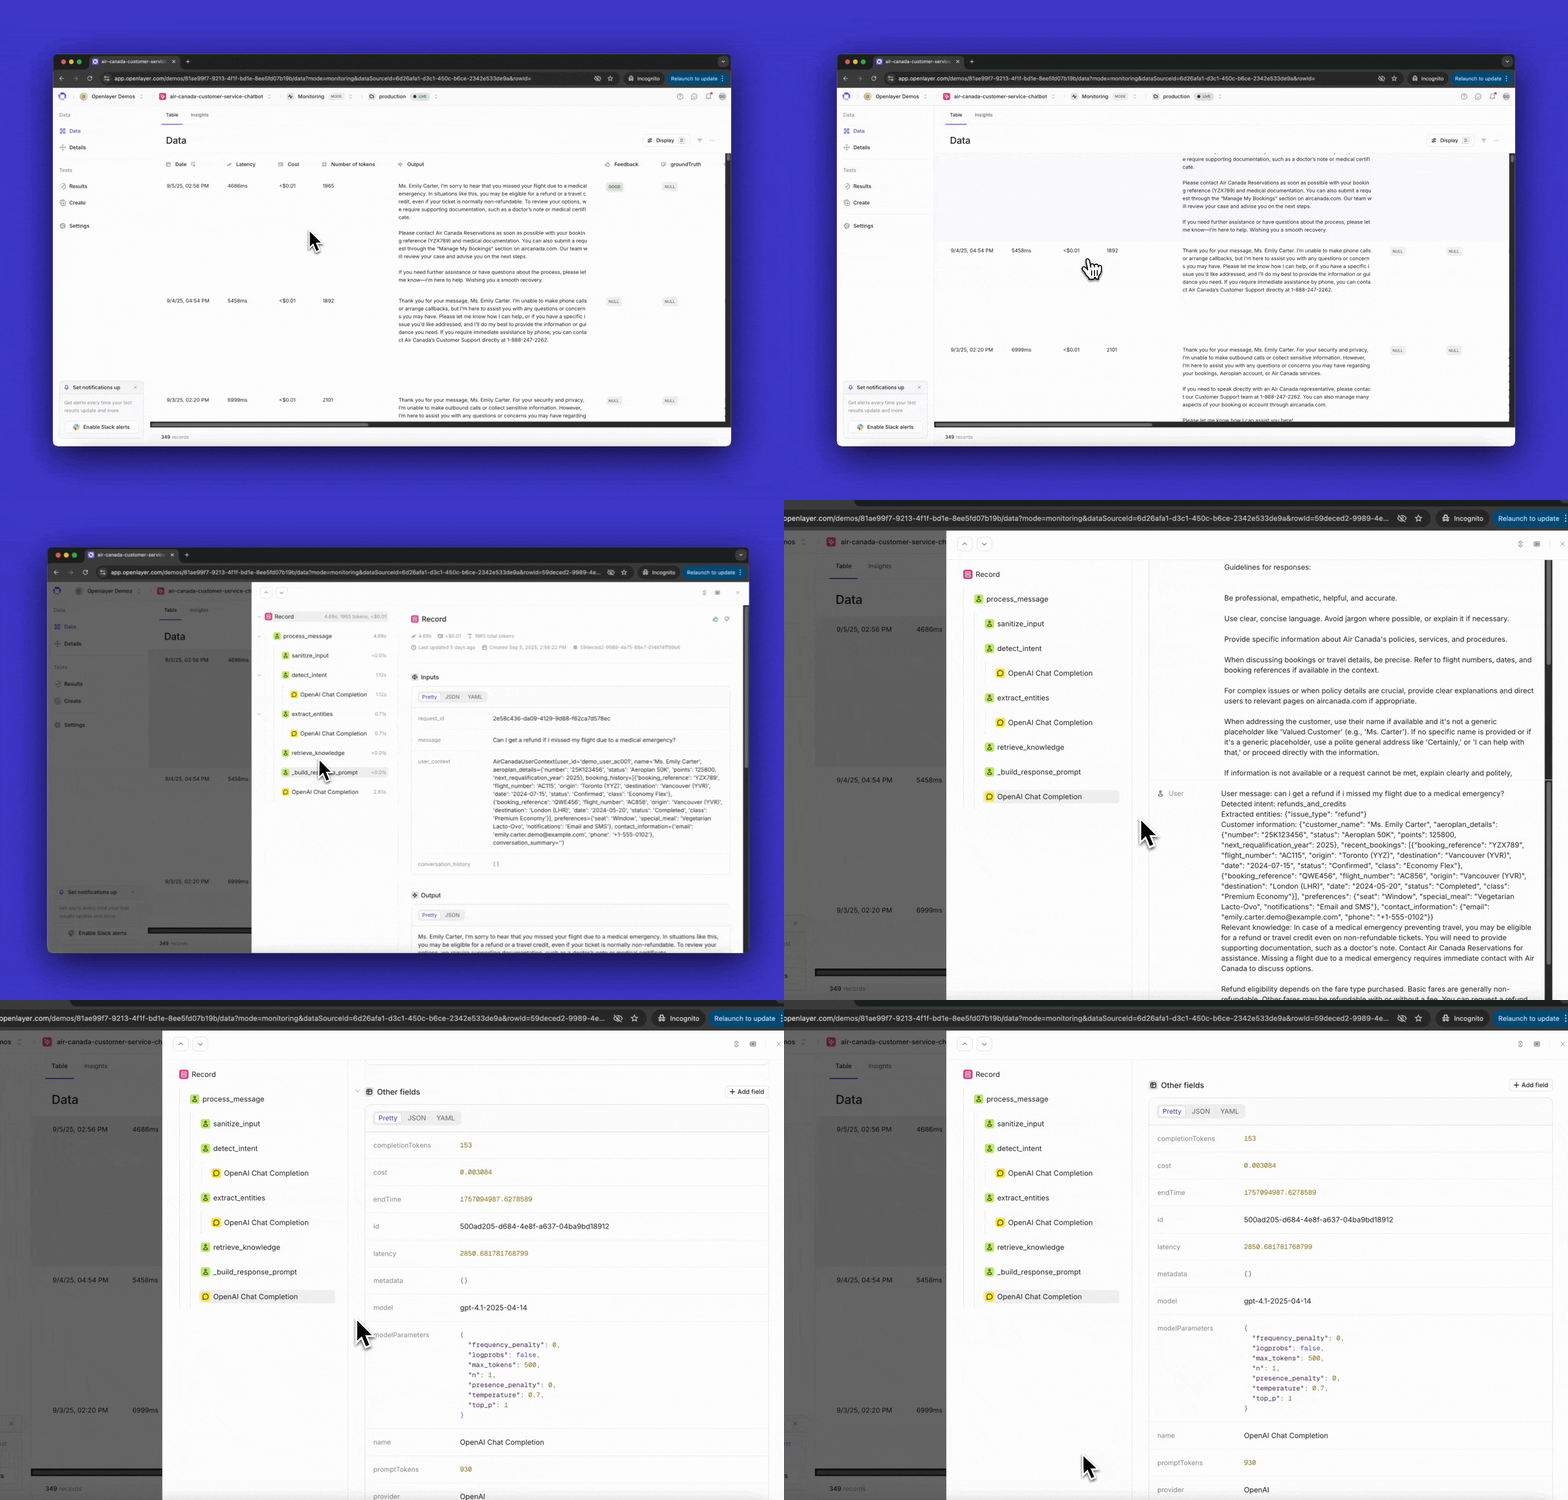
Once instrumented, every incoming request is published as a **trace** in the Openlayer platform.
A trace shows the full lifecycle of a request — including inputs, outputs, intermediate steps,
and metadata.
You can view them on the **Data** page inside your project.
 You can run automated tests at a regular cadence on top of your traces.
These tests cover a wide range of quality dimensions, from latency and cost to hallucination and prompt injection tests.
You can run automated tests at a regular cadence on top of your traces.
These tests cover a wide range of quality dimensions, from latency and cost to hallucination and prompt injection tests.
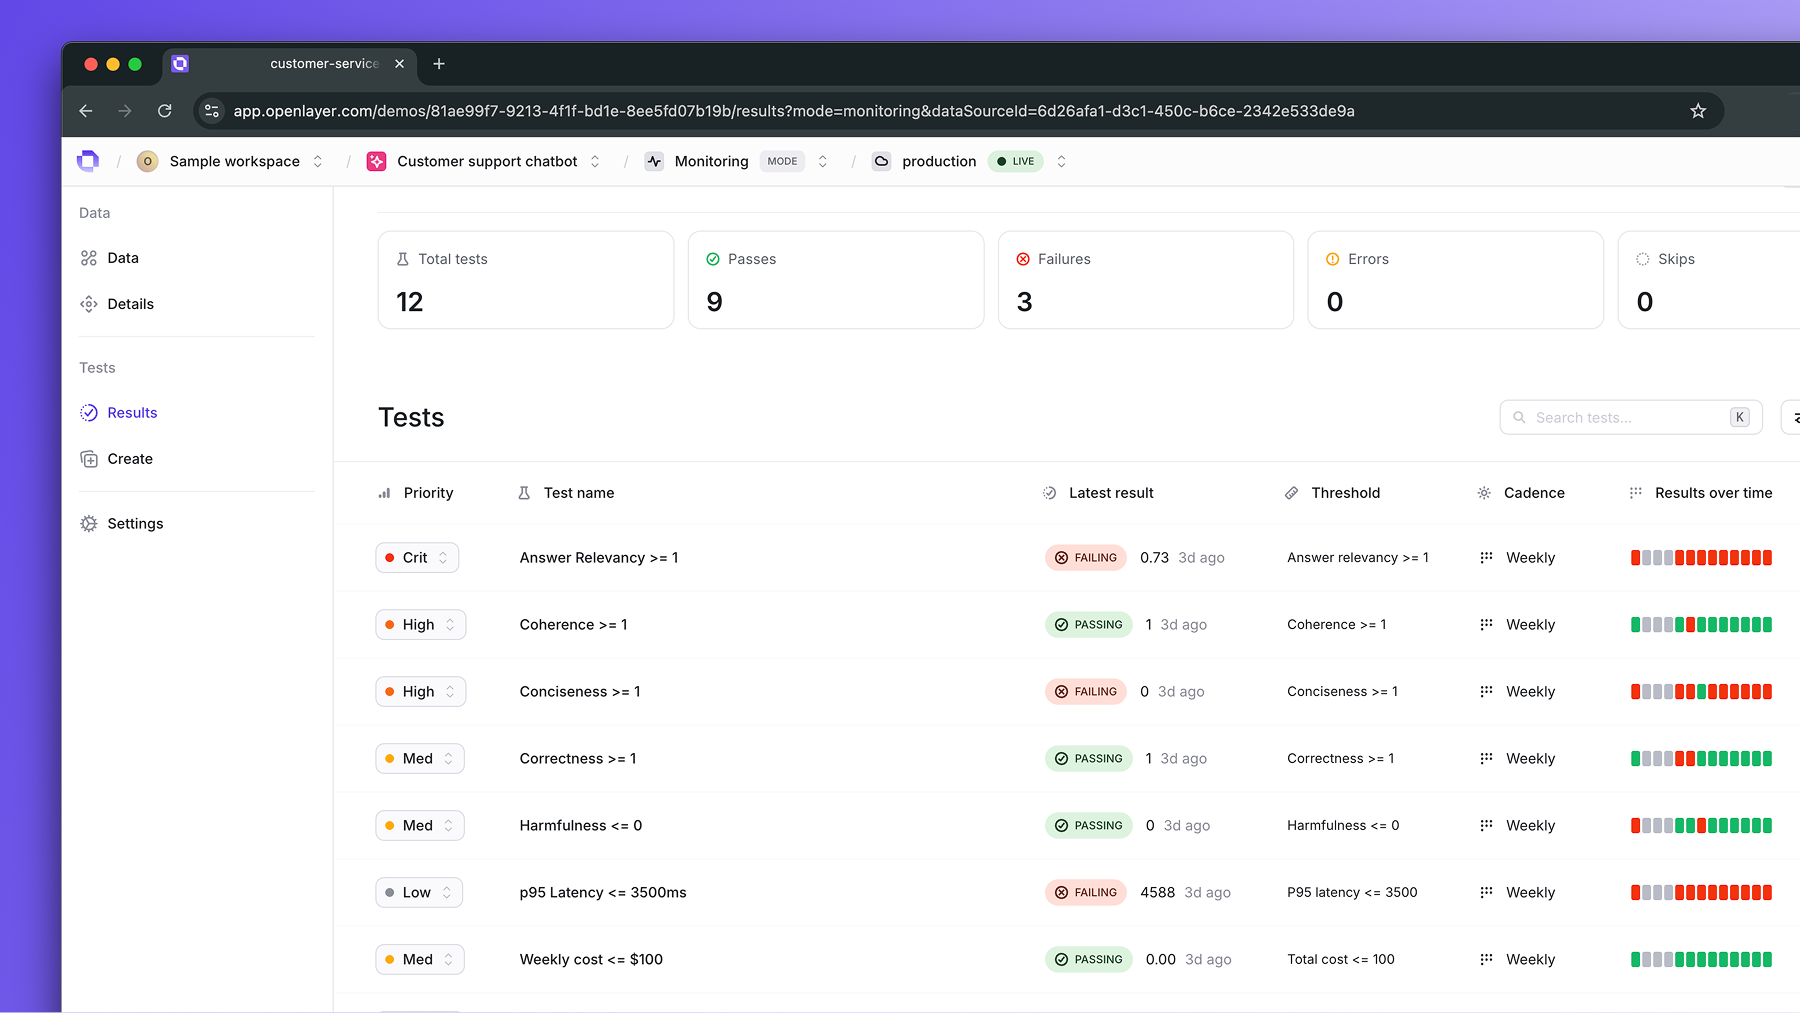 Check out the [Tests overview](/tests/overview) for details on how to set up tests.
Over time, successive test results show how your system’s health is evolving.
Configure notifications to be alerted immediately when a test fails—so you can
respond before small issues snowball into production incidents.
## Next steps
By continuously tracing, testing, and alerting, Openlayer gives you a feedback system
that keeps your AI trustworthy in real-world conditions.
To try it out,
check out the [Instrument your code](/monitoring/instrument) guide to learn how to integrate.
## FAQ
No, there are a few alternatives.
First, the Openlayer platform can be deployed **on-premises**. In this case, all the
data remains private in your own infrastructure.
Second, if you are already logging the data to a table in a **data lake**, such as
BigQuery, Databricks, Snowflake, and others, you can use a connector, and, Openlayer
will read the data from the table and run tests without replicating it.
If you prefer to use the SaaS version of Openlayer,
Openlayer takes security seriously and is SOC 2 Type II compliant.
The main difference between monitoring and development mode is the data used to run tests.
In development mode, tests run on a validation dataset curated by you. Furthermore, these
tests tend to run as part of a CI/CD pipeline to ensure that you are making systematic progress
as you iterate on your system versions.
In monitoring mode, tests run continuously on top of your live data, so you can spot issues
as soon as they appear in production.
Guardrails complement tests in monitoring mode.
While your Openlayer tests run continuously on top of your live data and trigger a
notification in case of failure, guardrails validate inputs and outputs in real time
and block or modify them if they don’t meet your constraints.
Together, they give you both proactive coverage (through tests) and reactive protection (through guardrails).
See the [Guardrails overview](/guardrails/overview) for details.
Check out the [Tests overview](/tests/overview) for details on how to set up tests.
Over time, successive test results show how your system’s health is evolving.
Configure notifications to be alerted immediately when a test fails—so you can
respond before small issues snowball into production incidents.
## Next steps
By continuously tracing, testing, and alerting, Openlayer gives you a feedback system
that keeps your AI trustworthy in real-world conditions.
To try it out,
check out the [Instrument your code](/monitoring/instrument) guide to learn how to integrate.
## FAQ
No, there are a few alternatives.
First, the Openlayer platform can be deployed **on-premises**. In this case, all the
data remains private in your own infrastructure.
Second, if you are already logging the data to a table in a **data lake**, such as
BigQuery, Databricks, Snowflake, and others, you can use a connector, and, Openlayer
will read the data from the table and run tests without replicating it.
If you prefer to use the SaaS version of Openlayer,
Openlayer takes security seriously and is SOC 2 Type II compliant.
The main difference between monitoring and development mode is the data used to run tests.
In development mode, tests run on a validation dataset curated by you. Furthermore, these
tests tend to run as part of a CI/CD pipeline to ensure that you are making systematic progress
as you iterate on your system versions.
In monitoring mode, tests run continuously on top of your live data, so you can spot issues
as soon as they appear in production.
Guardrails complement tests in monitoring mode.
While your Openlayer tests run continuously on top of your live data and trigger a
notification in case of failure, guardrails validate inputs and outputs in real time
and block or modify them if they don’t meet your constraints.
Together, they give you both proactive coverage (through tests) and reactive protection (through guardrails).
See the [Guardrails overview](/guardrails/overview) for details.