> ## Documentation Index
> Fetch the complete documentation index at: https://docs.openlayer.com/llms.txt
> Use this file to discover all available pages before exploring further.
# Workspace dashboard
> Use the Dashboard to scan recently viewed items, portfolio health, project status, compliance, and cost across your workspace
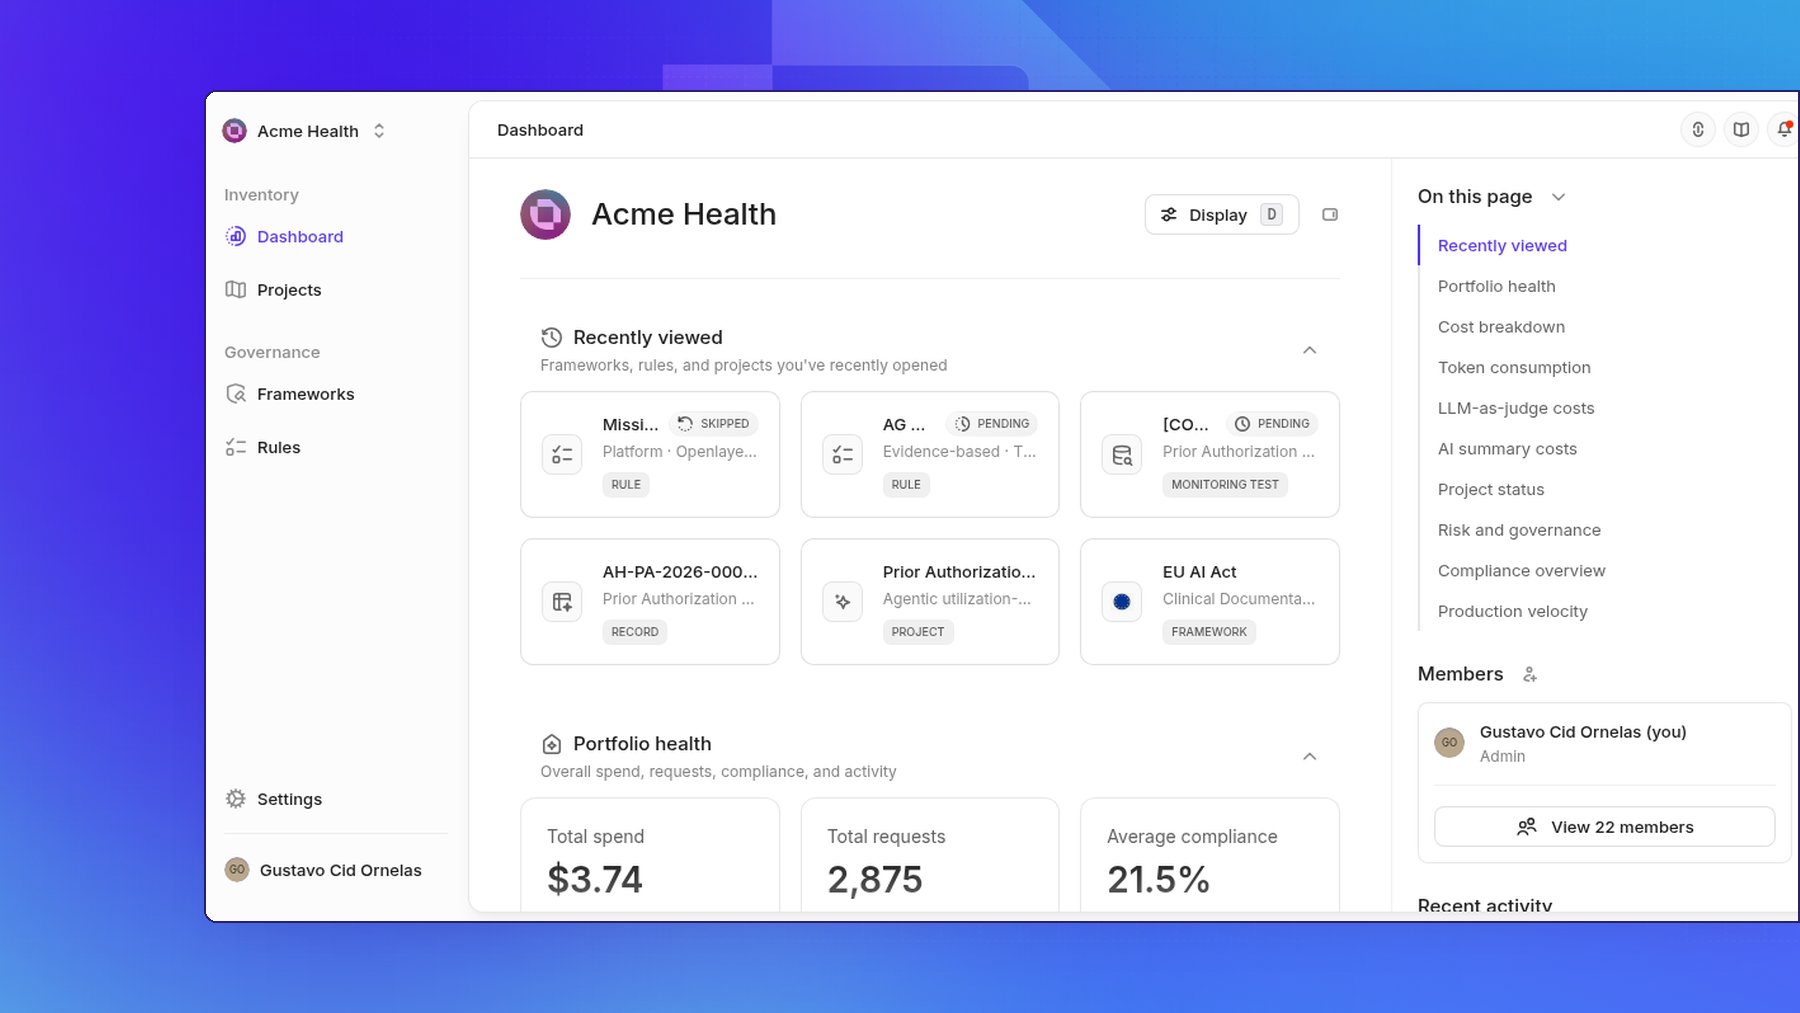
The **Dashboard** is the home of your workspace. In the sidebar, it lives under **Inventory**, next to **Projects**.
Use it to review recently viewed items, portfolio health, project status, risk and governance, compliance, production velocity, and cost.
 **Prerequisite**: you need an [Openlayer account](https://app.openlayer.com/)
to follow this guide.
## Open the dashboard
1. Log into your [Openlayer account](https://app.openlayer.com/).
2. In the sidebar, under **Inventory**, click **Dashboard**.
3. Or open the command palette and choose **Overview**. Search keywords include dashboard.
The page title is `{workspace.name} › Overview`.
A table of contents titled **On this page** lists the sections on the dashboard. Use the **Hide sidebar** and **Show sidebar** tooltips to collapse or expand it.
If there is nothing to show yet, the empty state is **Get started with Openlayer**, with **Start onboarding**.
## Sections
The dashboard is made up of these sections. Each section has a **Collapse section** control.
* **Recently viewed** — "Frameworks, rules, and projects you've recently opened"
* **Portfolio health** — "Overall spend, requests, compliance, and activity". Metrics: **Total spend**, **Total requests**, **Average compliance**, **Active projects**
* **Project status** — "Risk tier, approval state, and compliance per project". Table columns: **Project name**, **Lifecycle**, **Risk tier**, **Requests**, **Cost**
* **Risk and governance** — "Counts, inventory, and review time across risk tiers"
* **Compliance overview** — "Compliance progress for each pinned framework". Frameworks you pin show a **Pinned** chip, with **Workspace completion**, **Platform rules**, and **Evidence-based rules**
* **Production velocity** — "Average time from intake to production". Shows **Average speed to production**, with filter **All risk levels**
* **Cost breakdown** — "Spend broken down by project and by model". **Cost by project** / **Cost by model**
* **Token consumption** — "Token usage by project, with input, output, and cached"
* **LLM-as-judge costs**
* **AI summary costs**
## Customize display
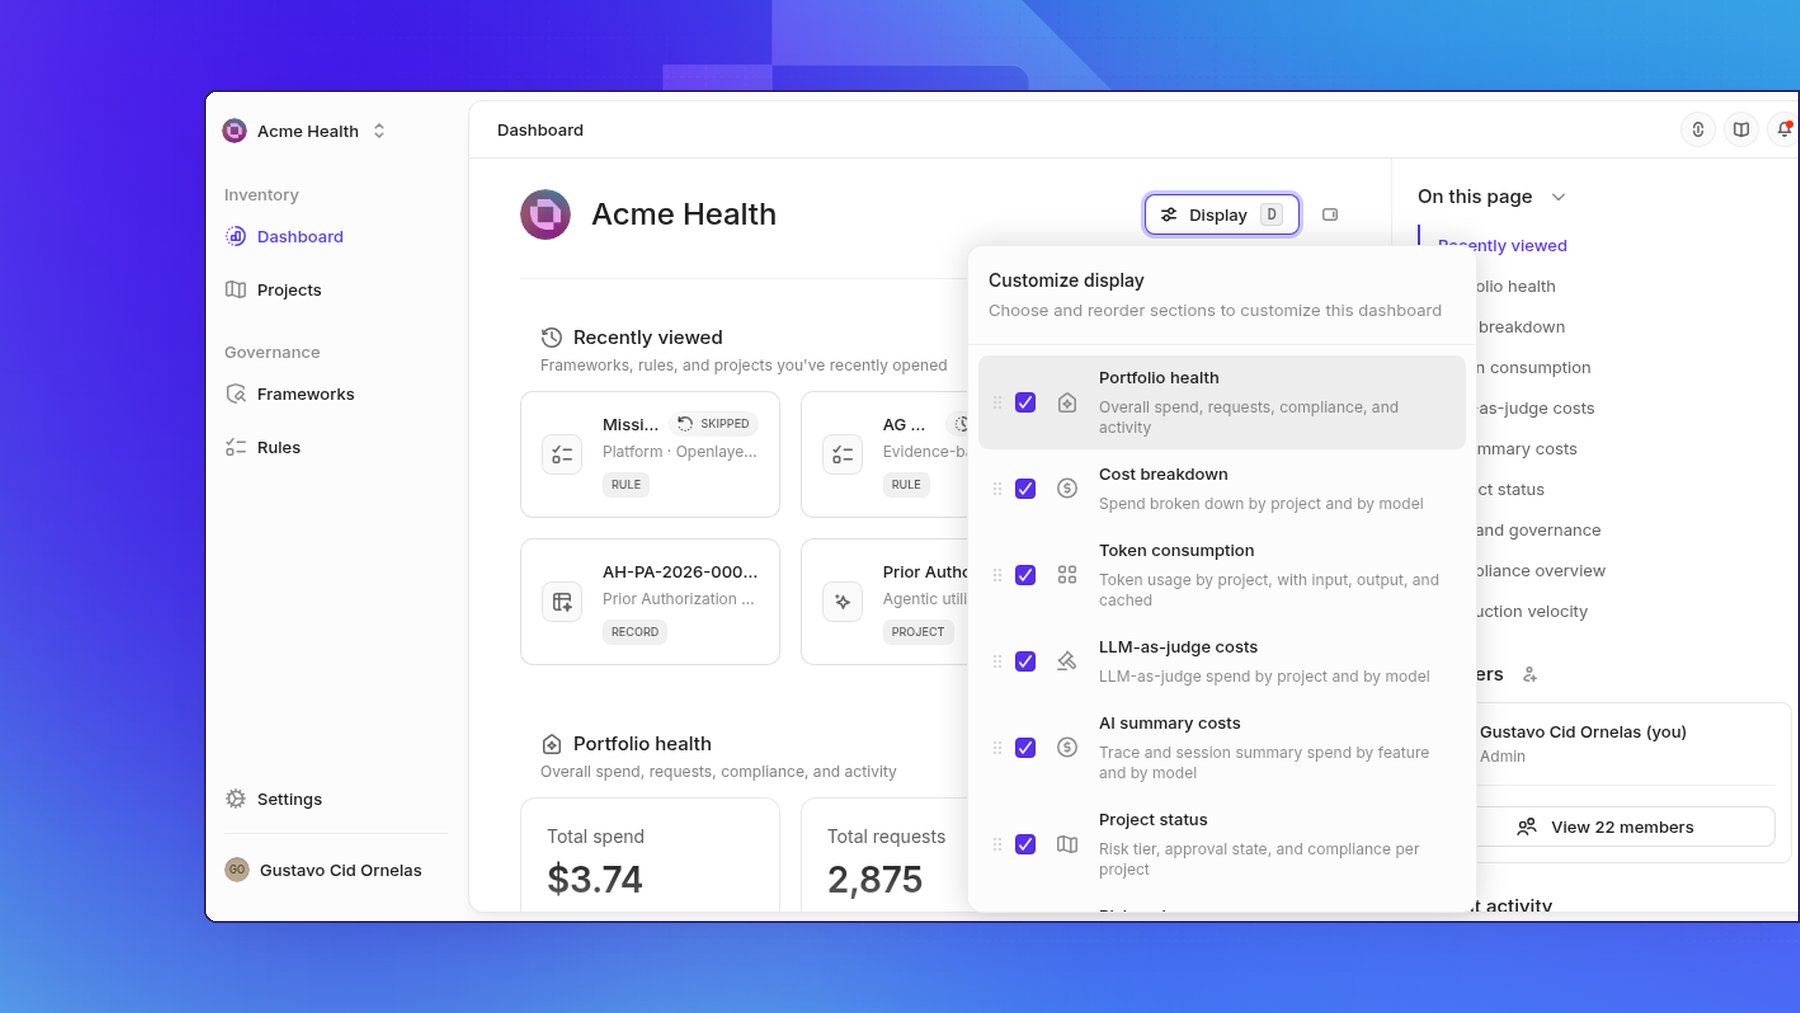
Click **Display** (keyboard shortcut `d`) to open the **Customize display** popover. Use it to choose and reorder sections: “Choose and reorder sections to customize this dashboard”.
**Prerequisite**: you need an [Openlayer account](https://app.openlayer.com/)
to follow this guide.
## Open the dashboard
1. Log into your [Openlayer account](https://app.openlayer.com/).
2. In the sidebar, under **Inventory**, click **Dashboard**.
3. Or open the command palette and choose **Overview**. Search keywords include dashboard.
The page title is `{workspace.name} › Overview`.
A table of contents titled **On this page** lists the sections on the dashboard. Use the **Hide sidebar** and **Show sidebar** tooltips to collapse or expand it.
If there is nothing to show yet, the empty state is **Get started with Openlayer**, with **Start onboarding**.
## Sections
The dashboard is made up of these sections. Each section has a **Collapse section** control.
* **Recently viewed** — "Frameworks, rules, and projects you've recently opened"
* **Portfolio health** — "Overall spend, requests, compliance, and activity". Metrics: **Total spend**, **Total requests**, **Average compliance**, **Active projects**
* **Project status** — "Risk tier, approval state, and compliance per project". Table columns: **Project name**, **Lifecycle**, **Risk tier**, **Requests**, **Cost**
* **Risk and governance** — "Counts, inventory, and review time across risk tiers"
* **Compliance overview** — "Compliance progress for each pinned framework". Frameworks you pin show a **Pinned** chip, with **Workspace completion**, **Platform rules**, and **Evidence-based rules**
* **Production velocity** — "Average time from intake to production". Shows **Average speed to production**, with filter **All risk levels**
* **Cost breakdown** — "Spend broken down by project and by model". **Cost by project** / **Cost by model**
* **Token consumption** — "Token usage by project, with input, output, and cached"
* **LLM-as-judge costs**
* **AI summary costs**
## Customize display
Click **Display** (keyboard shortcut `d`) to open the **Customize display** popover. Use it to choose and reorder sections: “Choose and reorder sections to customize this dashboard”.