If you use a framework that supports
OpenTelemetry (OTel), you can export traces
directly to Openlayer without needing to use Openlayer’s SDKs. See the
OpenTelemetry integration for more details.
How to set up tracing
You must use one of Openlayer’s SDKs to trace your system. After installing the SDK in your language of choice, follow the steps:Set environment variables
Before sending traces, tell Openlayer where to upload them by setting
two environment variables:
Shell
Instrument the code you want to trace
Annotate all the functions you want to trace with Openlayer’s SDK.The traced
generate_answer function in the example above uses an OpenAI LLM.
However, tracing also works for other LLM providers. If you set up any of the
streamlined approaches described in the Publishing data
guide, it will get added to the trace as well.Use the instrumented code
All data that goes through the instrumented code is automatically
streamed to the Openlayer platform, where your tests and alerts are defined.In the example above, if we call the resulting trace would be: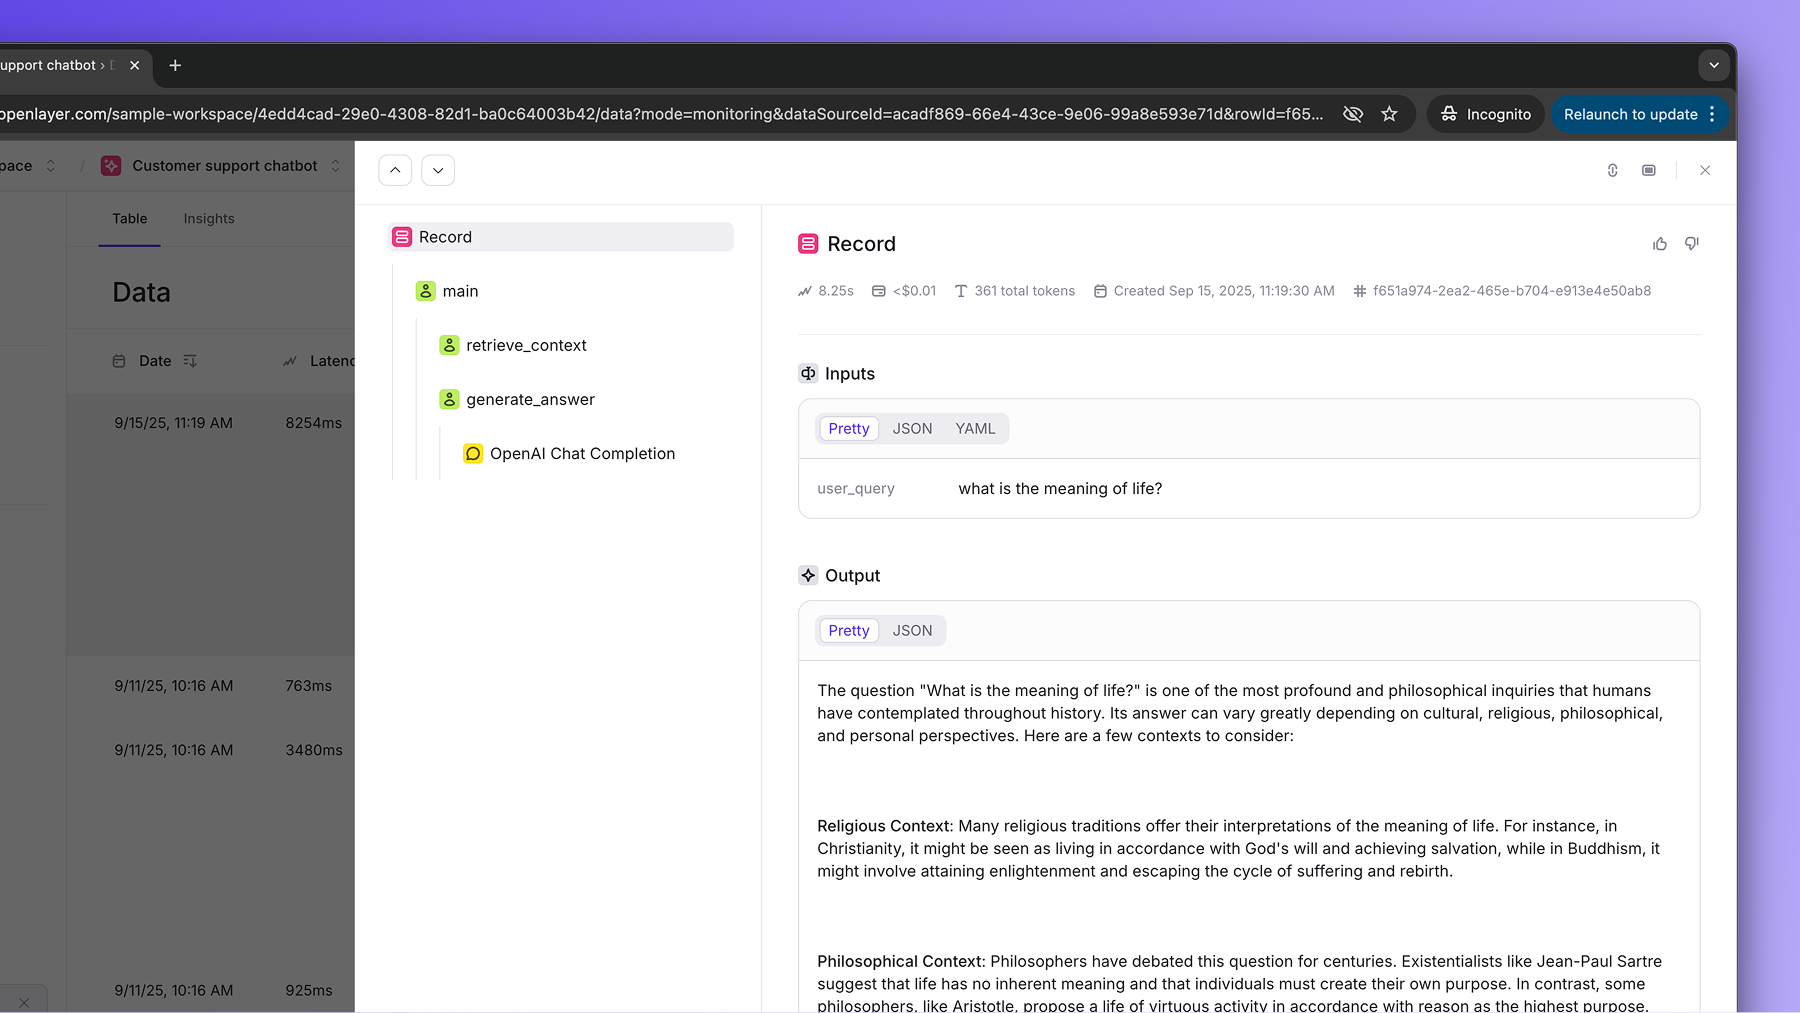
main:main function has two nested steps: retrieve_context, and
generate_answer. The generate_answer has a chat completion call within it. The cost,
number of tokens, latency, and other metadata are all computed automatically behind the
scenes.