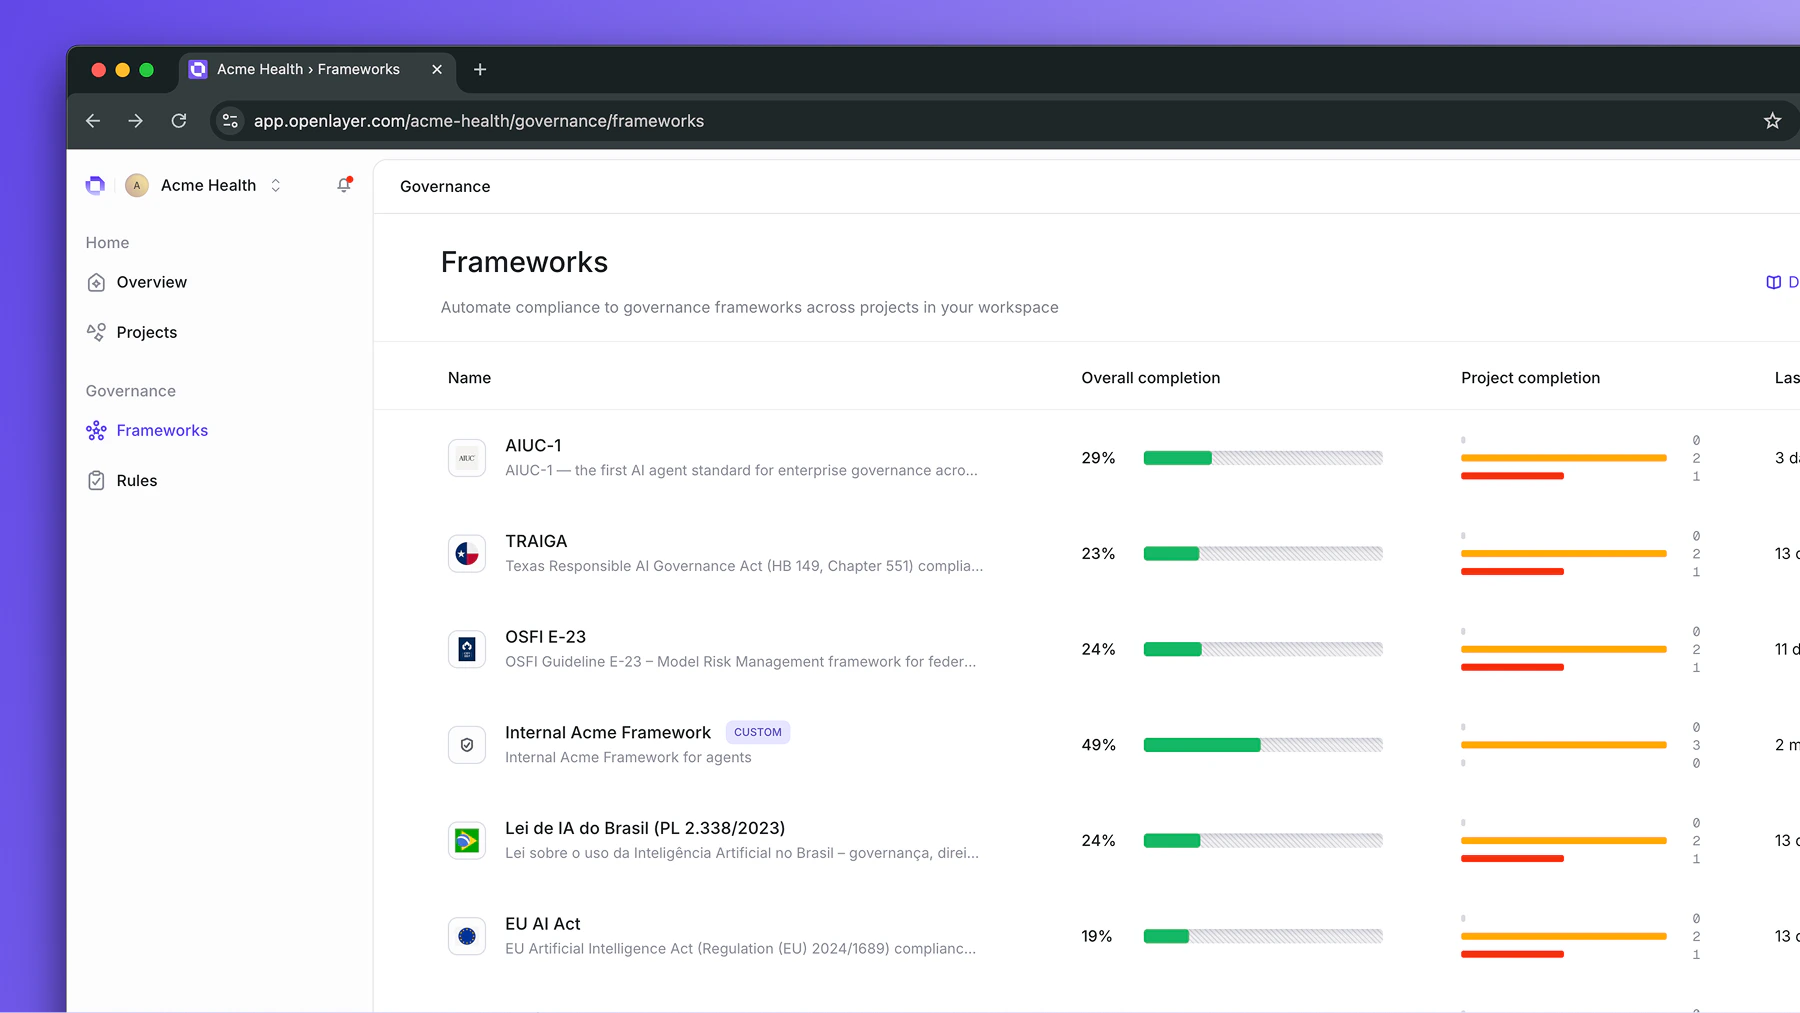
The Governance dashboard gives you a real-time view of compliance across every project in your workspace — so you can see where teams are on track and where they need attention.

The frameworks list

Navigate to Governance > Frameworks. Each framework shows two metrics:
  • Overall completion — the aggregate compliance percentage across all rules and all projects
  • Project completion — a stacked bar showing a histogram of project completions
Frameworks list with completion bars

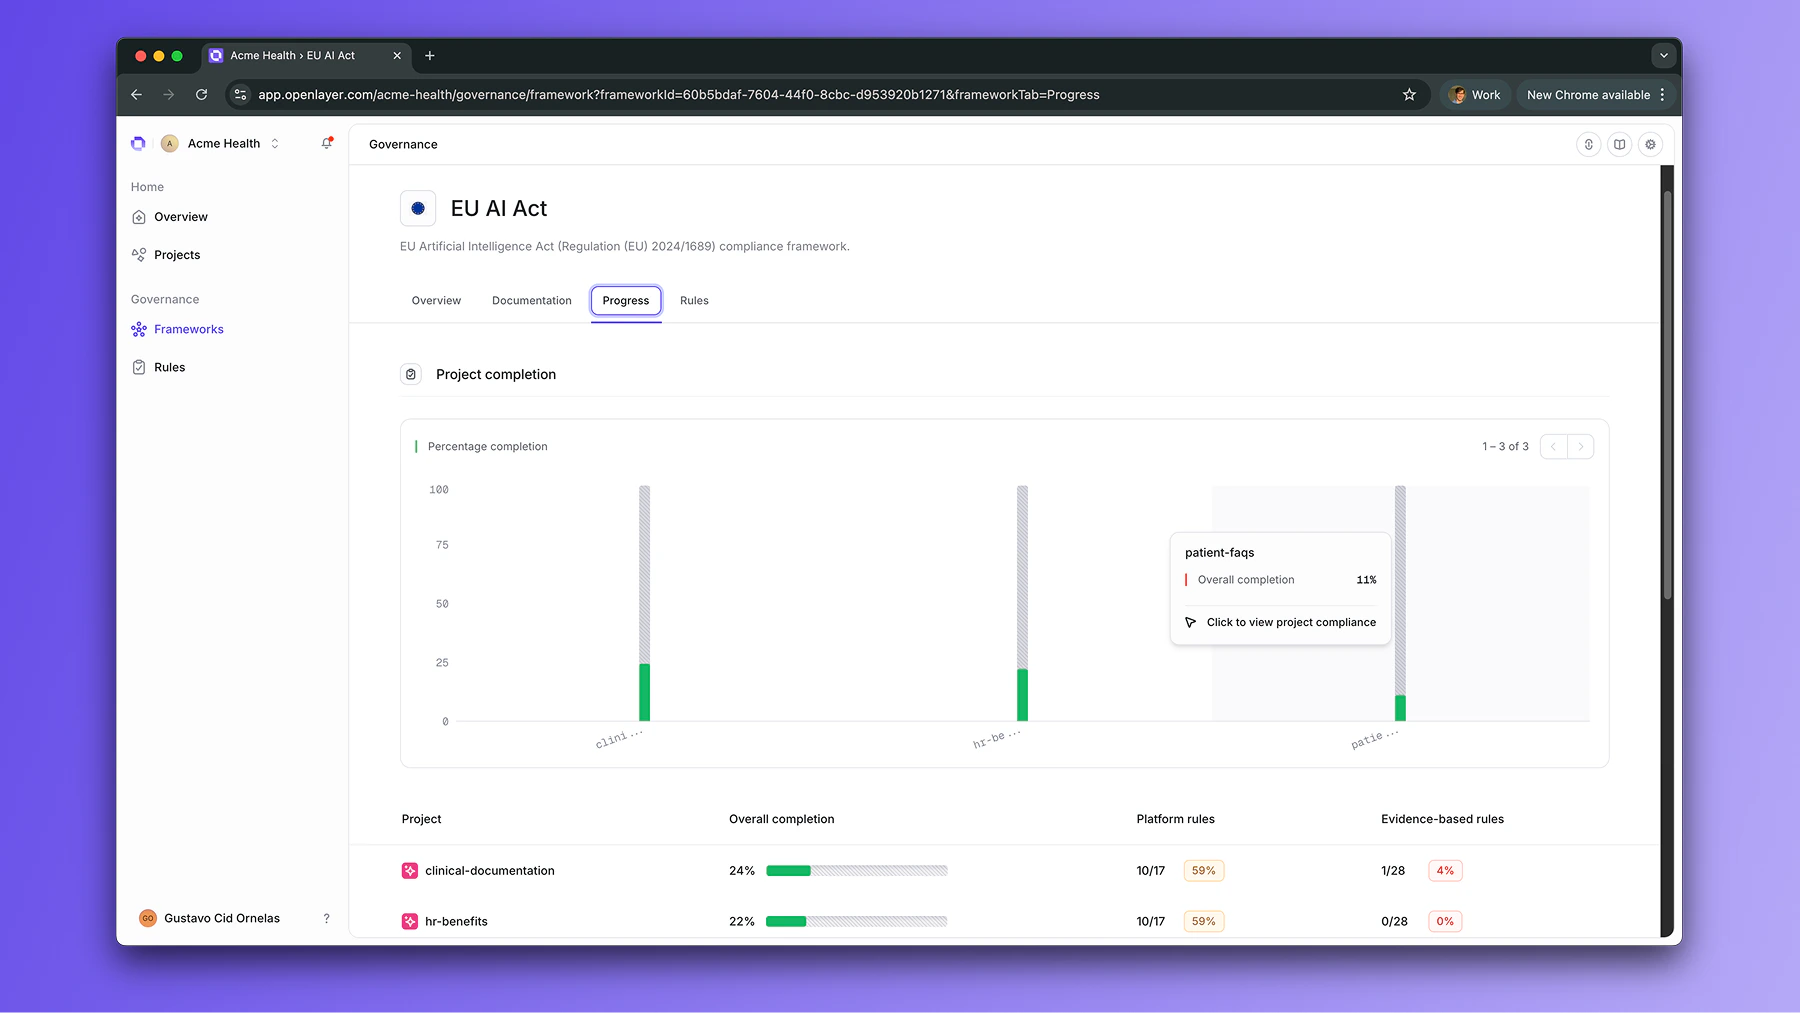
Drilling into a framework

Click any framework to open its Overview tab. Here you’ll see:
  • Workspace completion — the overall percentage across all scoped projects
  • Platform rules completion — how teams are doing on the automated rules
  • Evidence-based rules completion — progress on document uploads and policy links
The Progress tab provides a per-project breakdown, showing exactly which projects are passing or failing and which specific rules are blocking them. Framework overview with completion breakdown

Acting on the data

Click into any rule to see which projects are failing it and who the assigned owners are. You can then contact the responsible team members directly to unblock progress. From the Overview tab, you can also export a governance summary — a snapshot of compliance status across all frameworks and projects — for audits or leadership reviews.