

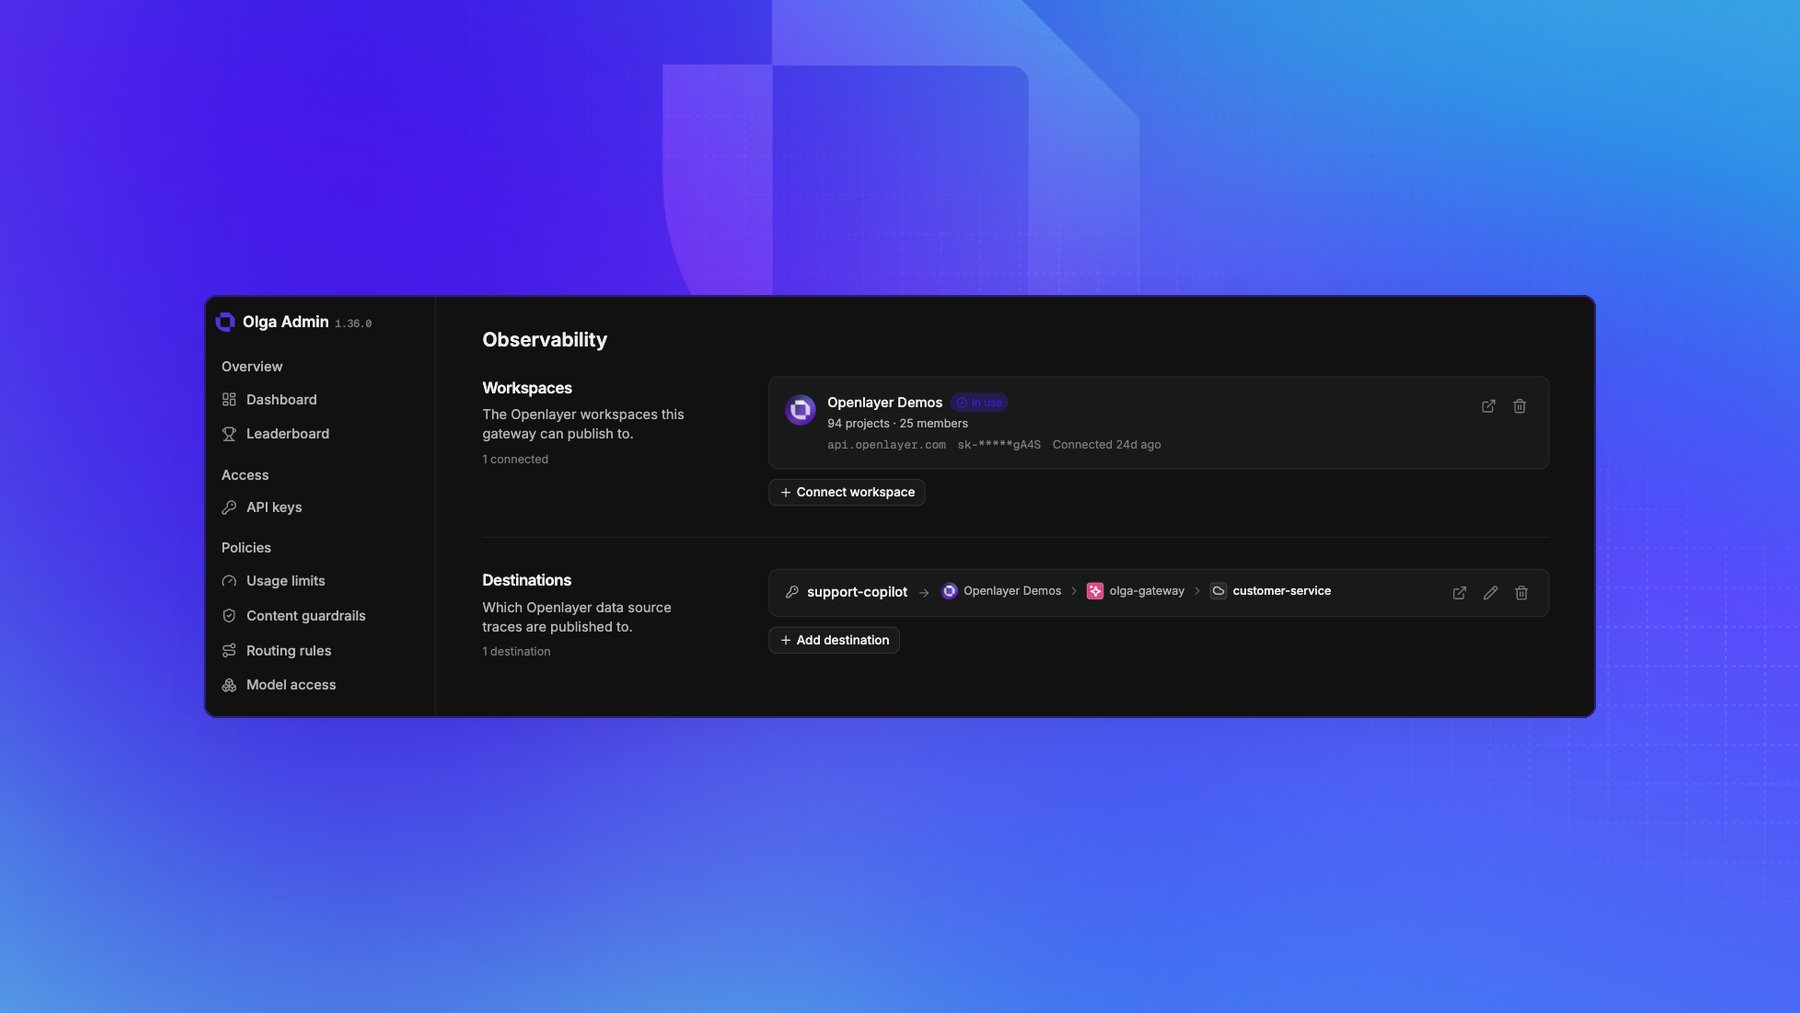
Connect a workspace
On the Observability page under Settings, connect an Openlayer workspace:- API key: an Openlayer API key for the workspace. The gateway verifies it before storing it, and encrypts it at rest.
- Base URL: the Openlayer installation the workspace lives in. Leave it blank for Openlayer’s public API, or set it if you run Openlayer on-premises.
Route traffic to a data source
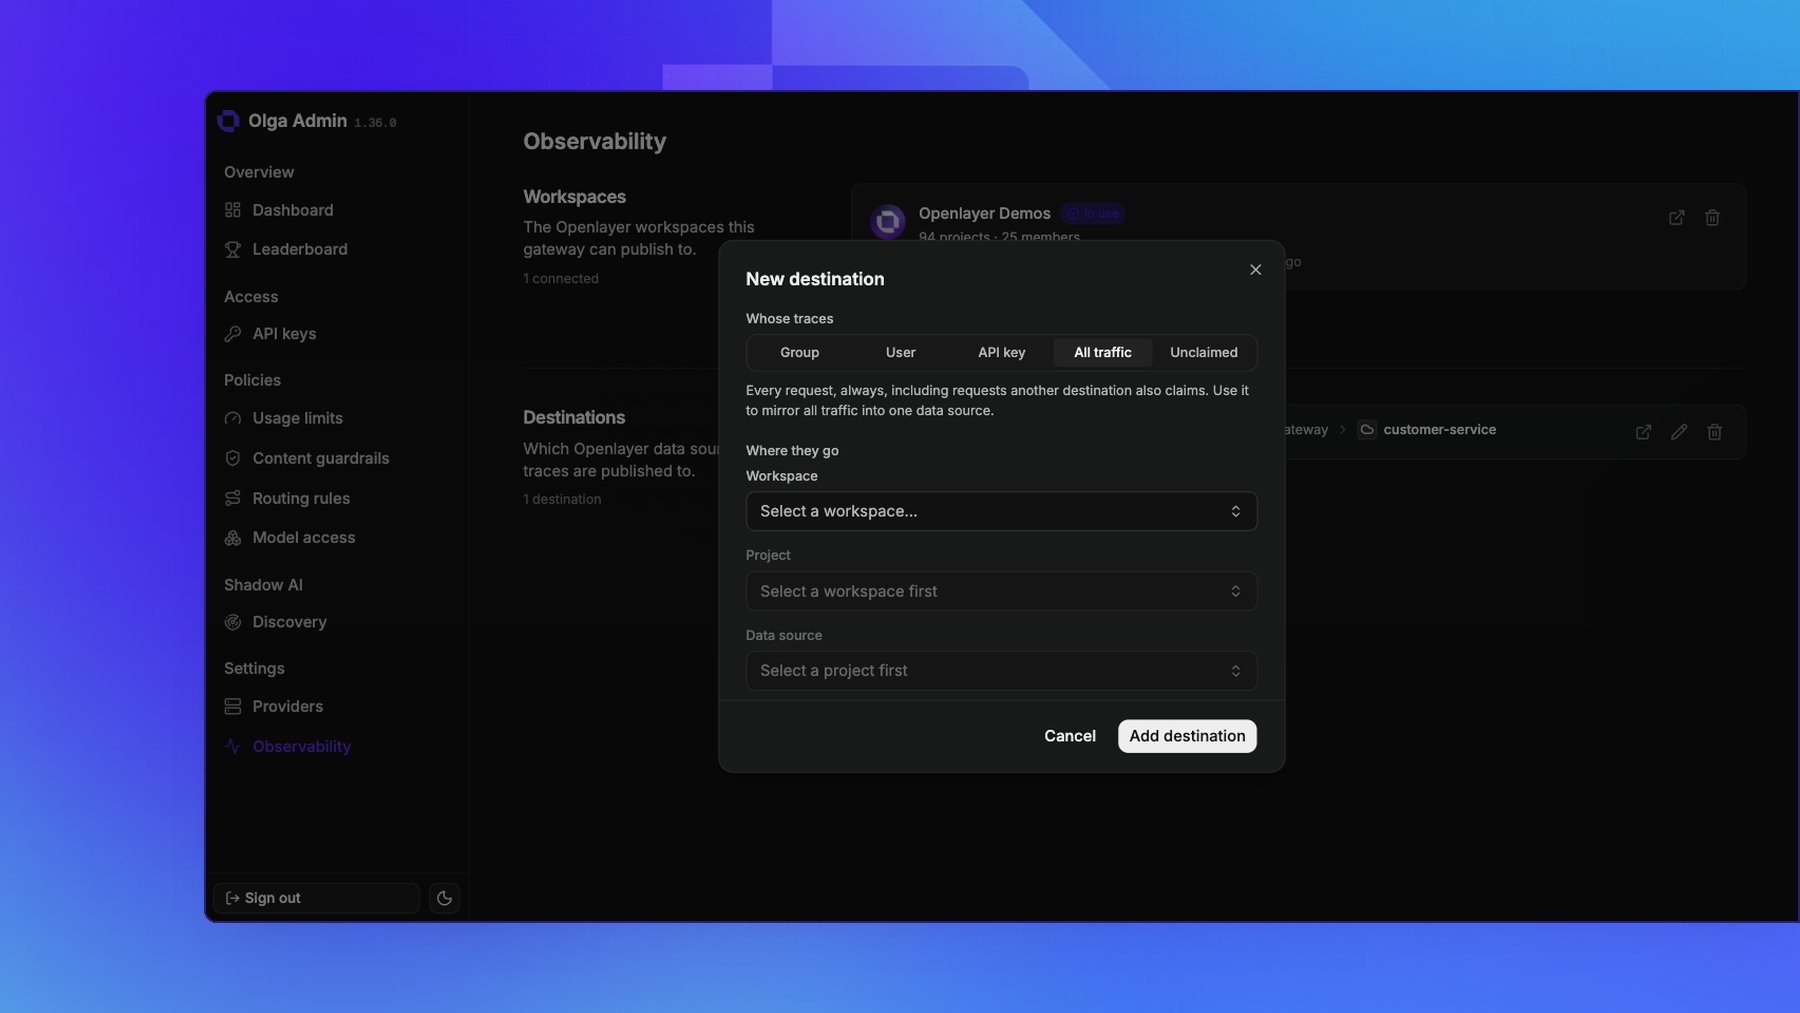
A destination pairs a target with the Openlayer data source its traces land in:- Whose traces: a Group, a User, one API key, All traffic, or Unclaimed. The group picker also offers No group.
- Where they go: a workspace, then a project, then a data source. You can create a project or a data source from the picker without leaving the portal.
- All traffic always fires, including on requests something else already claimed. It’s how you mirror everything into one data source while specific targets keep their own.
- Unclaimed is a fallback rather than a rule that fires alongside the others. It takes only the traffic no more specific destination claimed, so a key with a group destination publishes to that group’s data source and not also to the default.
What’s in a trace
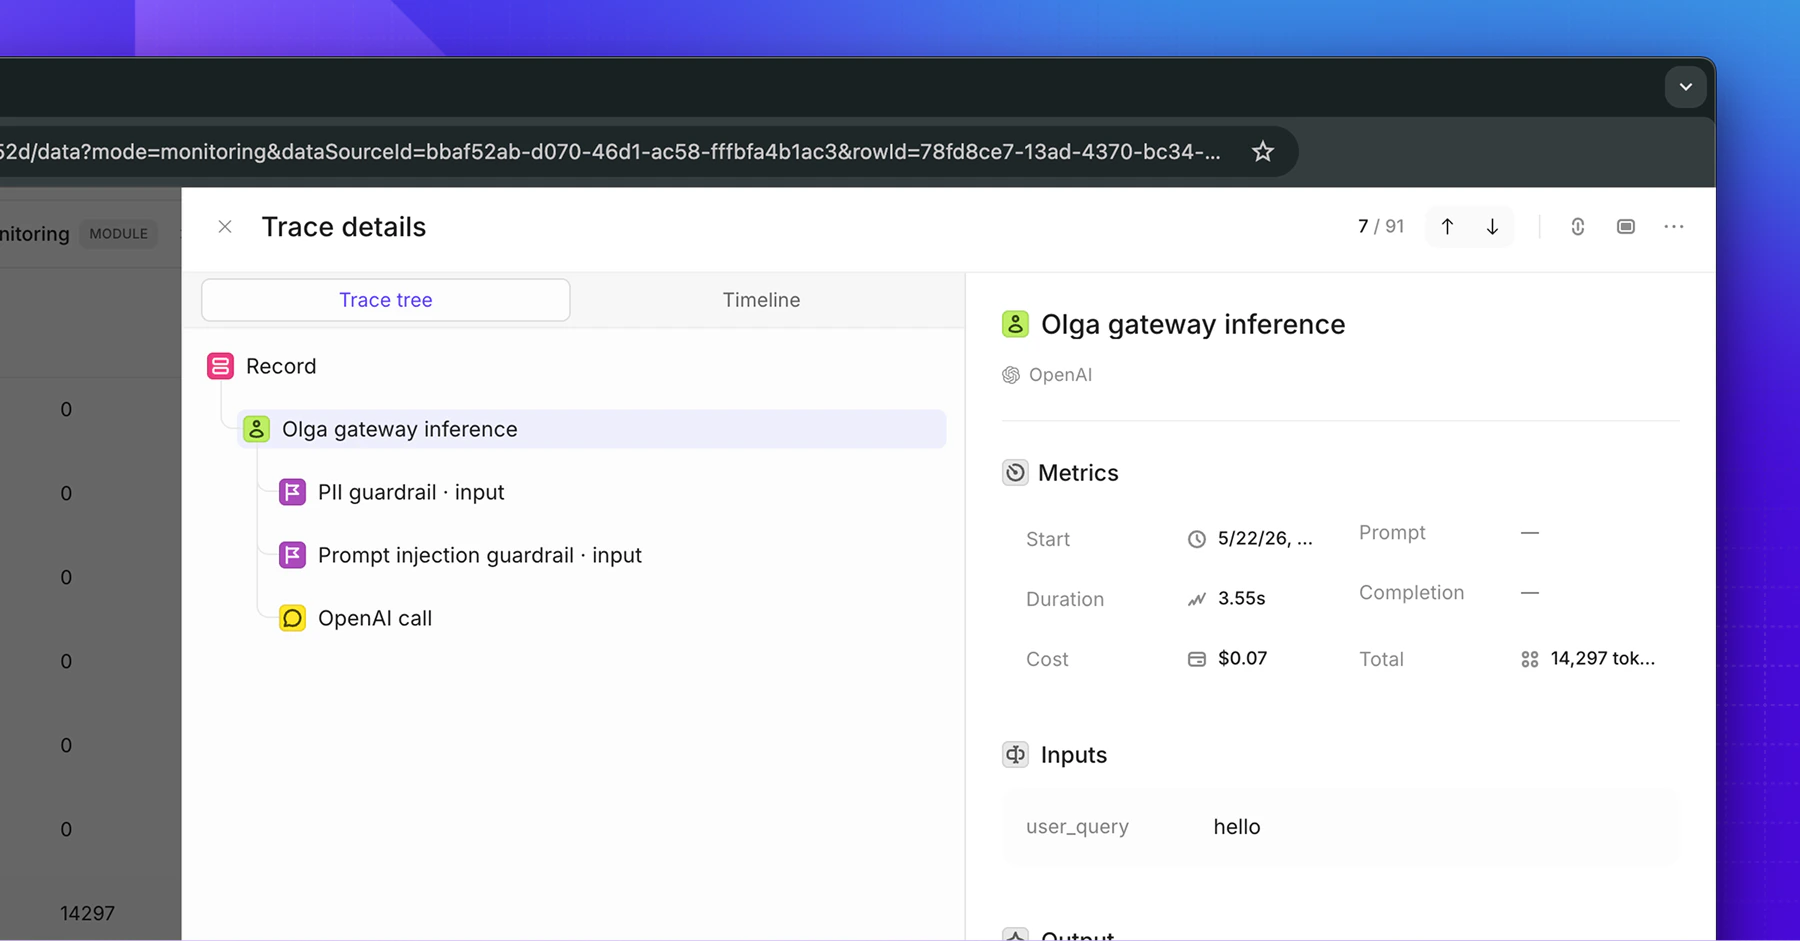
Each trace captures the full shape of the request:- The model and provider that served it.
- Input messages and the output text.
- Tokens, latency, and cost.
- Status, success or error, with the error message when one occurs.
- Any guardrail violations, as steps in the trace.
- Any media in the request or response.
embedding step with a summary such as
2 embeddings, 1536 dimensions. The trace doesn’t include the vector values.
Media in traces
Images and documents sent to or returned by a model are carried into the trace as attachments. The gateway uploads the bytes to Openlayer storage and the trace references them, rather than carrying base64 inline, so a trace with a large image stays readable. Two deployment-wide options govern this: whether to upload attachment bytes at all, and whether to upload media a request supplied as a URL. Attachment uploads are on and URL uploads are off by default. Ask us to change them if you need media kept out of Openlayer entirely.Attribute traffic to a user
When an API key is created with a User ID, every request it makes carries that ID into the trace. In Openlayer you can then group and filter traffic by user.It never blocks a response
Tracing is fire-and-forget. The gateway sends each trace in the background after the response has gone out, so observability never slows a request down, and never fails one if Openlayer is unreachable.Correlate with your logs
Send anX-Request-ID header with a request and the gateway uses it as the trace ID, so you can
line up your own logs with the trace in Openlayer. Omit it and the gateway generates one.