Prerequisite: you need an Openlayer account
to follow this guide.
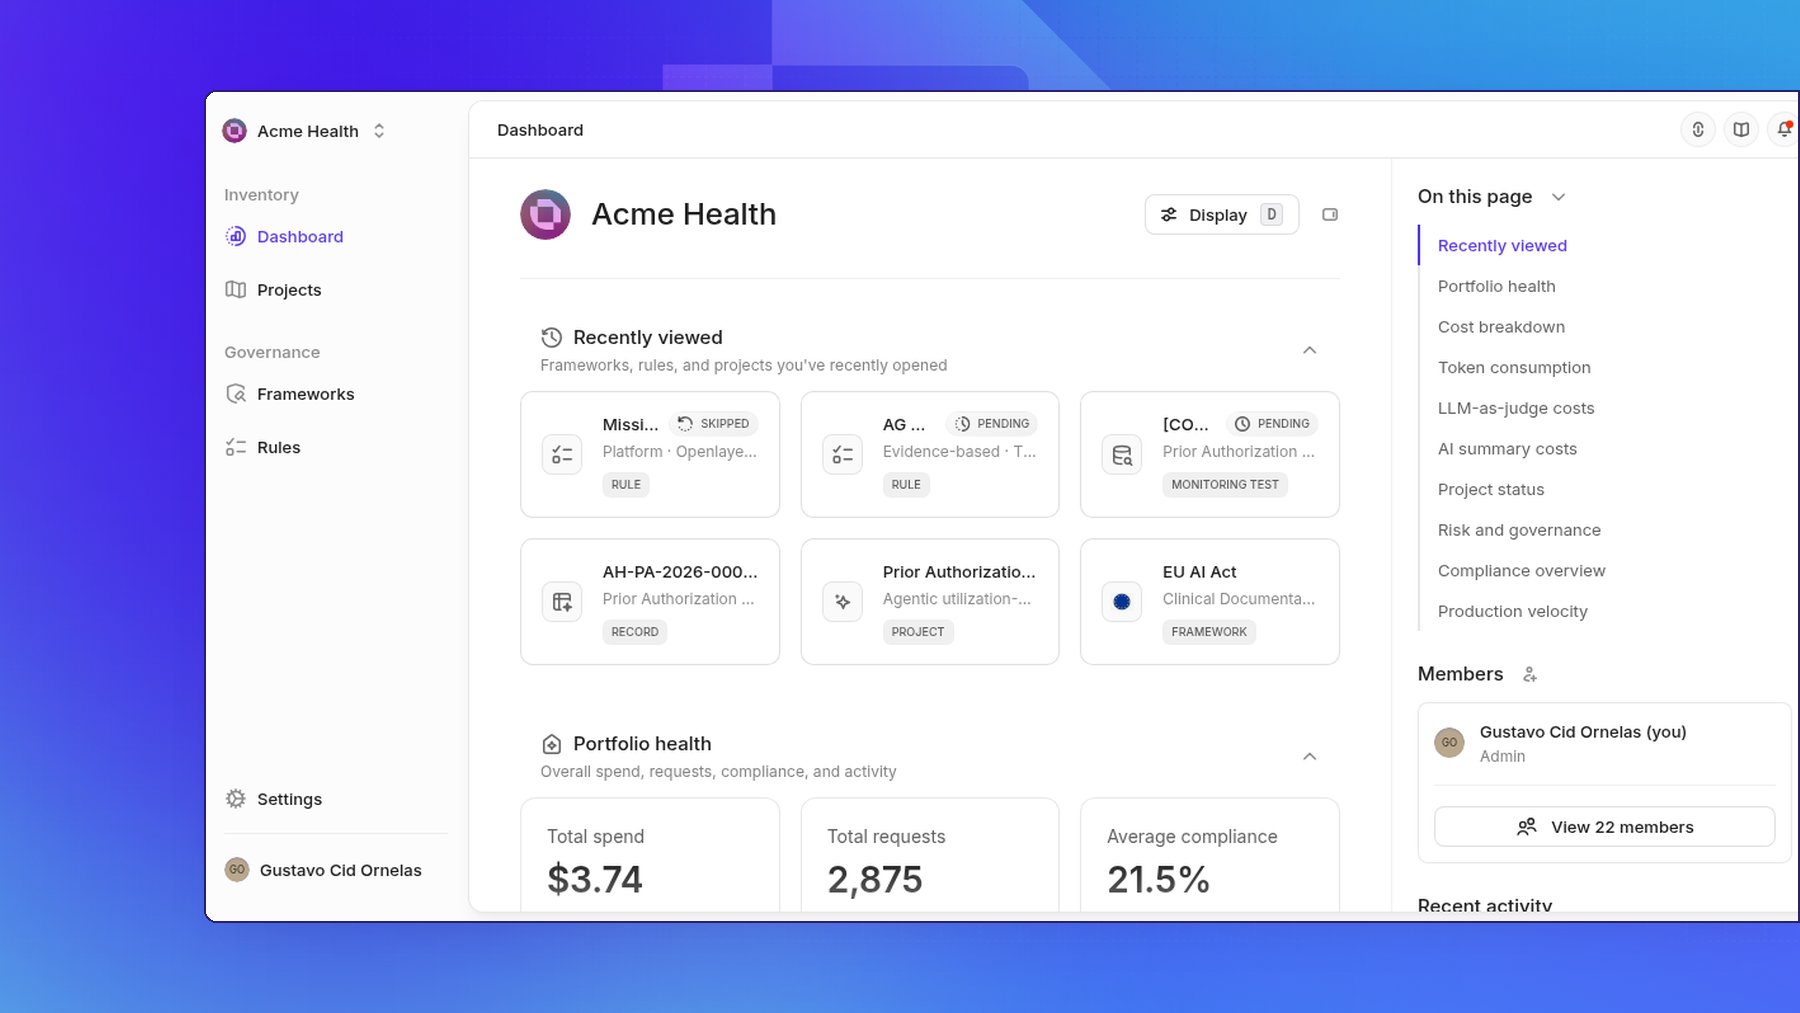
Open the dashboard
- Log into your Openlayer account.
- In the sidebar, under Inventory, click Dashboard.
- Or open the command palette and choose Overview. Search keywords include dashboard.
{workspace.name} › Overview.
A table of contents titled On this page lists the sections on the dashboard. Use the Hide sidebar and Show sidebar tooltips to collapse or expand it.
If there is nothing to show yet, the empty state is Get started with Openlayer, with Start onboarding.
Sections
The dashboard is made up of these sections. Each section has a Collapse section control.- Recently viewed — “Frameworks, rules, and projects you’ve recently opened”
- Portfolio health — “Overall spend, requests, compliance, and activity”. Metrics: Total spend, Total requests, Average compliance, Active projects
- Project status — “Risk tier, approval state, and compliance per project”. Table columns: Project name, Lifecycle, Risk tier, Requests, Cost
- Risk and governance — “Counts, inventory, and review time across risk tiers”
- Compliance overview — “Compliance progress for each pinned framework”. Frameworks you pin show a Pinned chip, with Workspace completion, Platform rules, and Evidence-based rules
- Production velocity — “Average time from intake to production”. Shows Average speed to production, with filter All risk levels
- Cost breakdown — “Spend broken down by project and by model”. Cost by project / Cost by model
- Token consumption — “Token usage by project, with input, output, and cached”
- LLM-as-judge costs
- AI summary costs
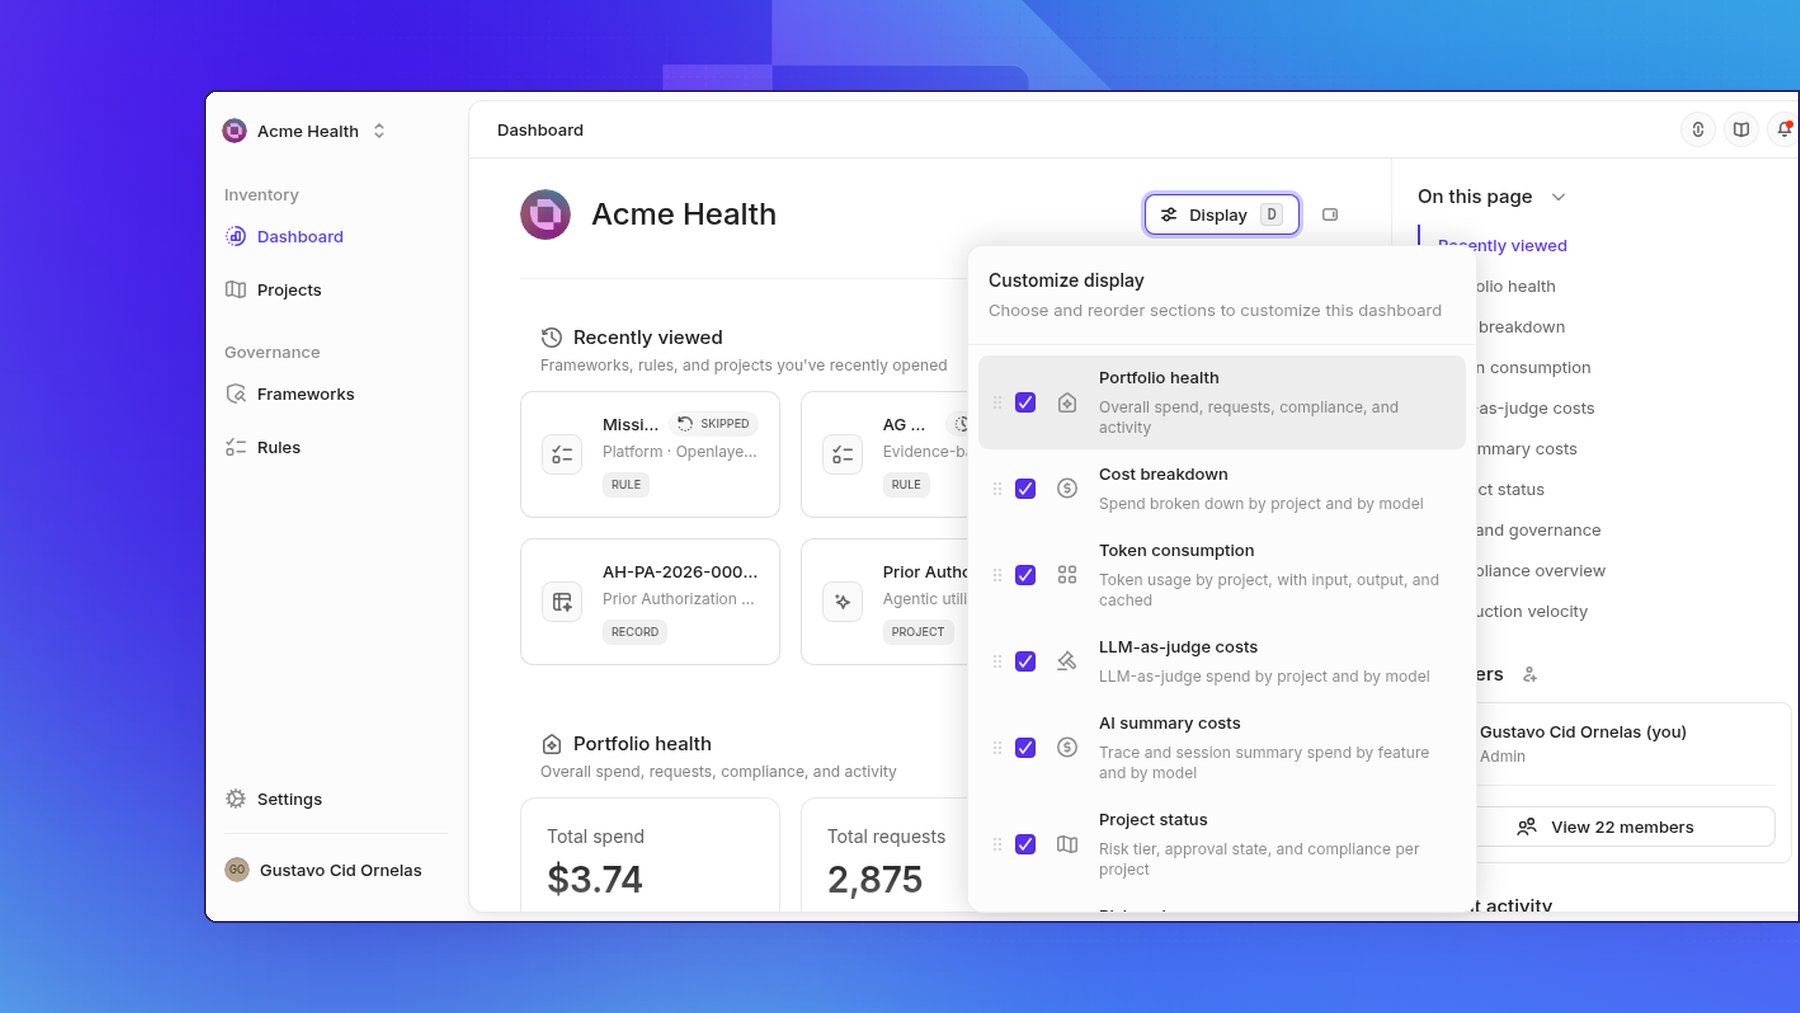
Customize display
Click Display (keyboard shortcutd) to open the Customize display popover. Use it to choose and reorder sections: “Choose and reorder sections to customize this dashboard”.